Fig. 2
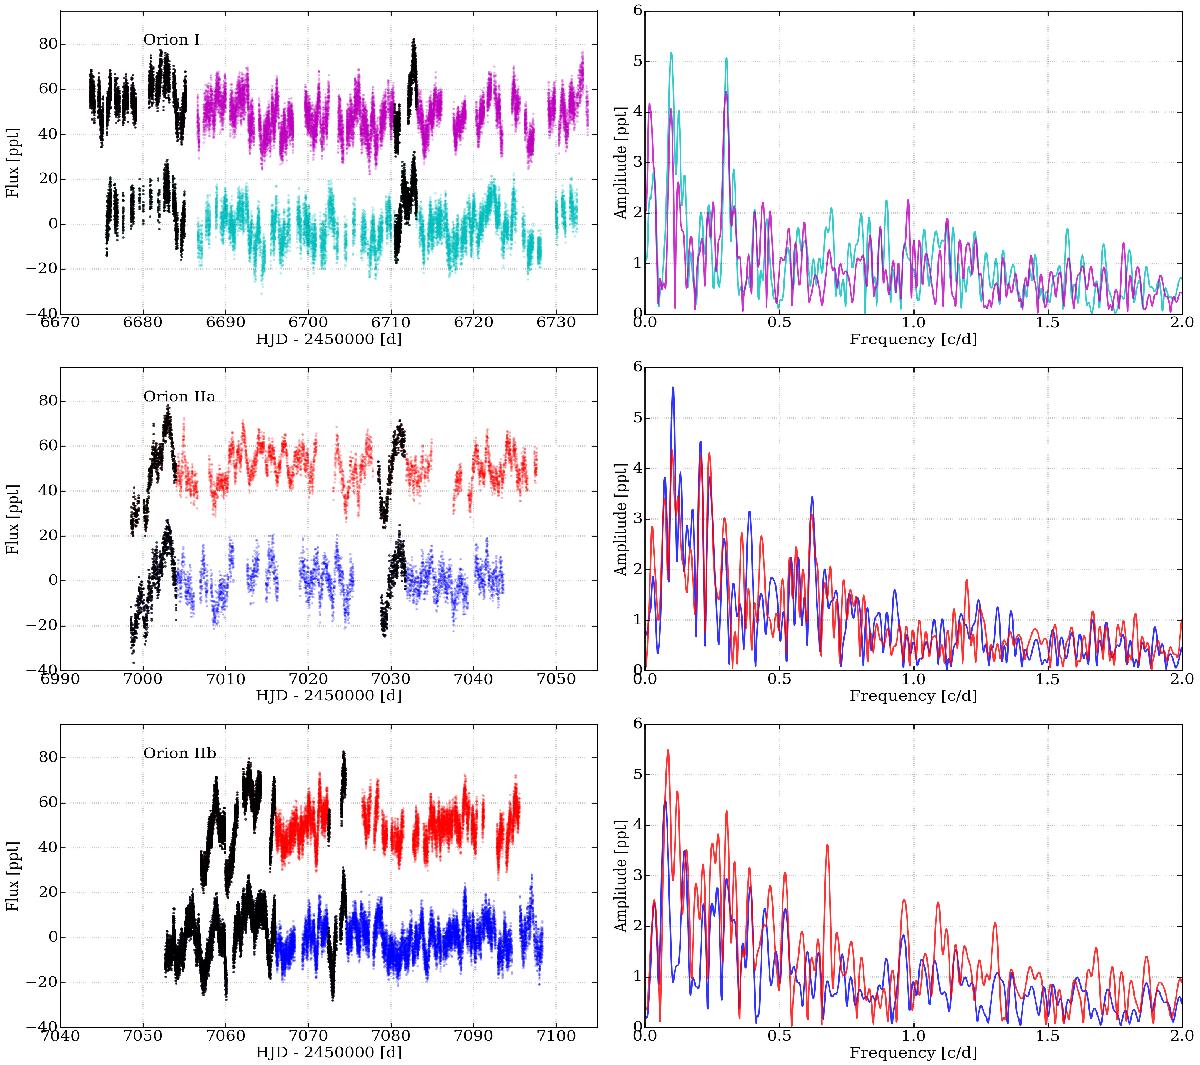
Left: BRITE photometry of ζ Ori during the three distinct epochs, used for the time series analysis. The color represents which nano-satellite of the BRITE-Constellation monitored ζ Ori: magenta for UBr, cyan for BAb, red for BHr, and blue for BLb. The regions having non-periodic events, which were excluded for a dedicated analysis, are marked in black (see text). Right: corresponding Lomb-Scargle periodograms of the full lightcurves. No significant periodic variability was found outside the region of 0 to 1 d-1. Variability is marked in parts per thousand (ppt).
Current usage metrics show cumulative count of Article Views (full-text article views including HTML views, PDF and ePub downloads, according to the available data) and Abstracts Views on Vision4Press platform.
Data correspond to usage on the plateform after 2015. The current usage metrics is available 48-96 hours after online publication and is updated daily on week days.
Initial download of the metrics may take a while.