Fig. A.5
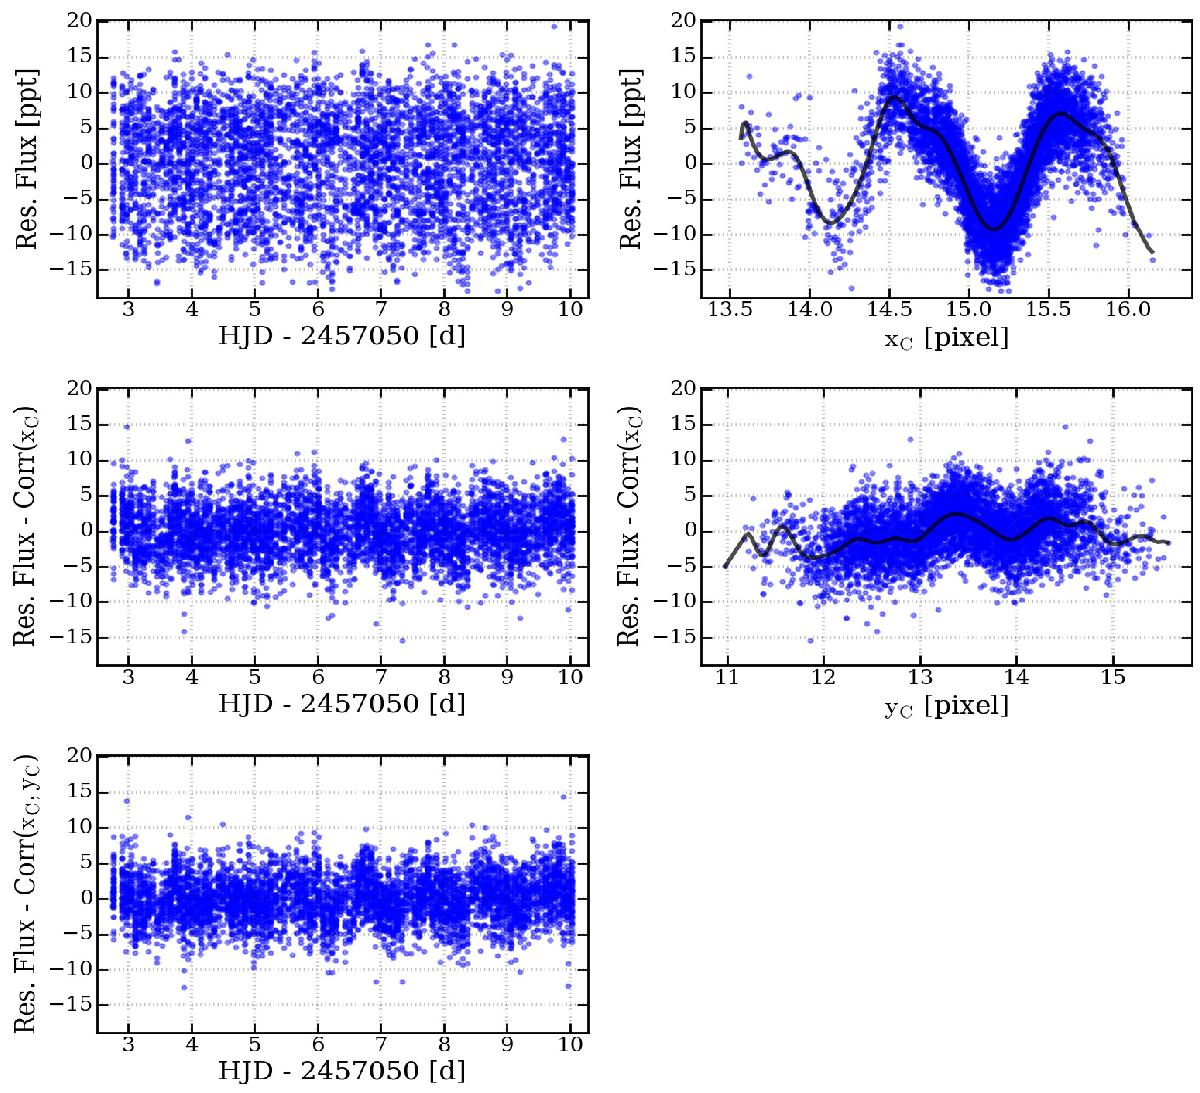
Top left: BLb residual flux of ζ Ori given in blue, from the first correction window of Fig. A.4, which was subtracted by a local linear regression of the flux acting as a model for the stellar signal, Fstar(t), and for the long-term instrumental signal. Top right: same residual flux as a function of the CCD centroid position xc indicating the correlation, which is approximated by the B-spline given in black. The correlation between flux and xc is more dominant than with yc, hence it is decorrelated first, as indicated by the AIC and BIC. Middle left: same BLb flux residuals, now corrected for the correlation with xc. Middle right: correlation between the corrected flux residuals and yc, together with the B-spline representation in black. Bottom left: final flux residuals, corrected for the correlation with both CCD centroid positions, ready to correct for remaining instrumental effects. The periodic variations in this final product is caused by the periodic TCCD fluctuations (see Fig. A.4).
Current usage metrics show cumulative count of Article Views (full-text article views including HTML views, PDF and ePub downloads, according to the available data) and Abstracts Views on Vision4Press platform.
Data correspond to usage on the plateform after 2015. The current usage metrics is available 48-96 hours after online publication and is updated daily on week days.
Initial download of the metrics may take a while.