Fig. 4
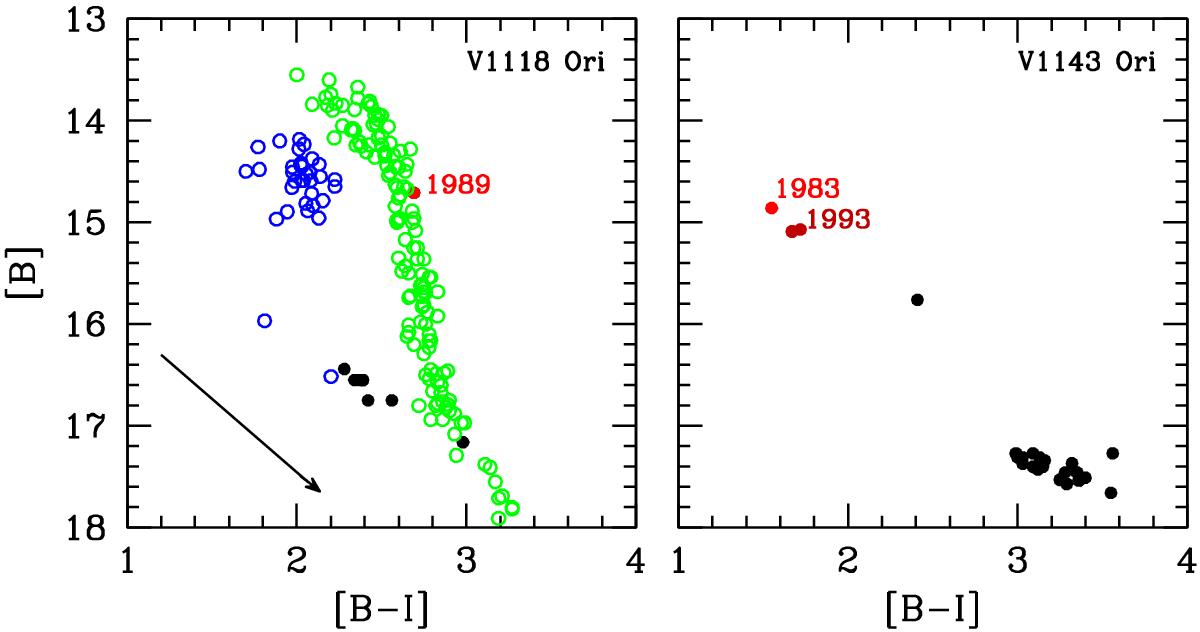
B vs. [B−I] colour−magnitude plot of V1118 (left) and V1143 Ori (right). In the left panel open circles (in blue) refer to our data still unpublished (Giannini et al., in prep.). Solid circles (black and red) refer to the present data. Green circles are given for comparison purposes and refer to a recent outburst of V1118 monitored by Audard et al. (2005). In the lower-left corner the arrow indicates an extinction of AV = 1 mag, according to the law by Rieke & Lebofsky (1985).
Current usage metrics show cumulative count of Article Views (full-text article views including HTML views, PDF and ePub downloads, according to the available data) and Abstracts Views on Vision4Press platform.
Data correspond to usage on the plateform after 2015. The current usage metrics is available 48-96 hours after online publication and is updated daily on week days.
Initial download of the metrics may take a while.