Fig. 1
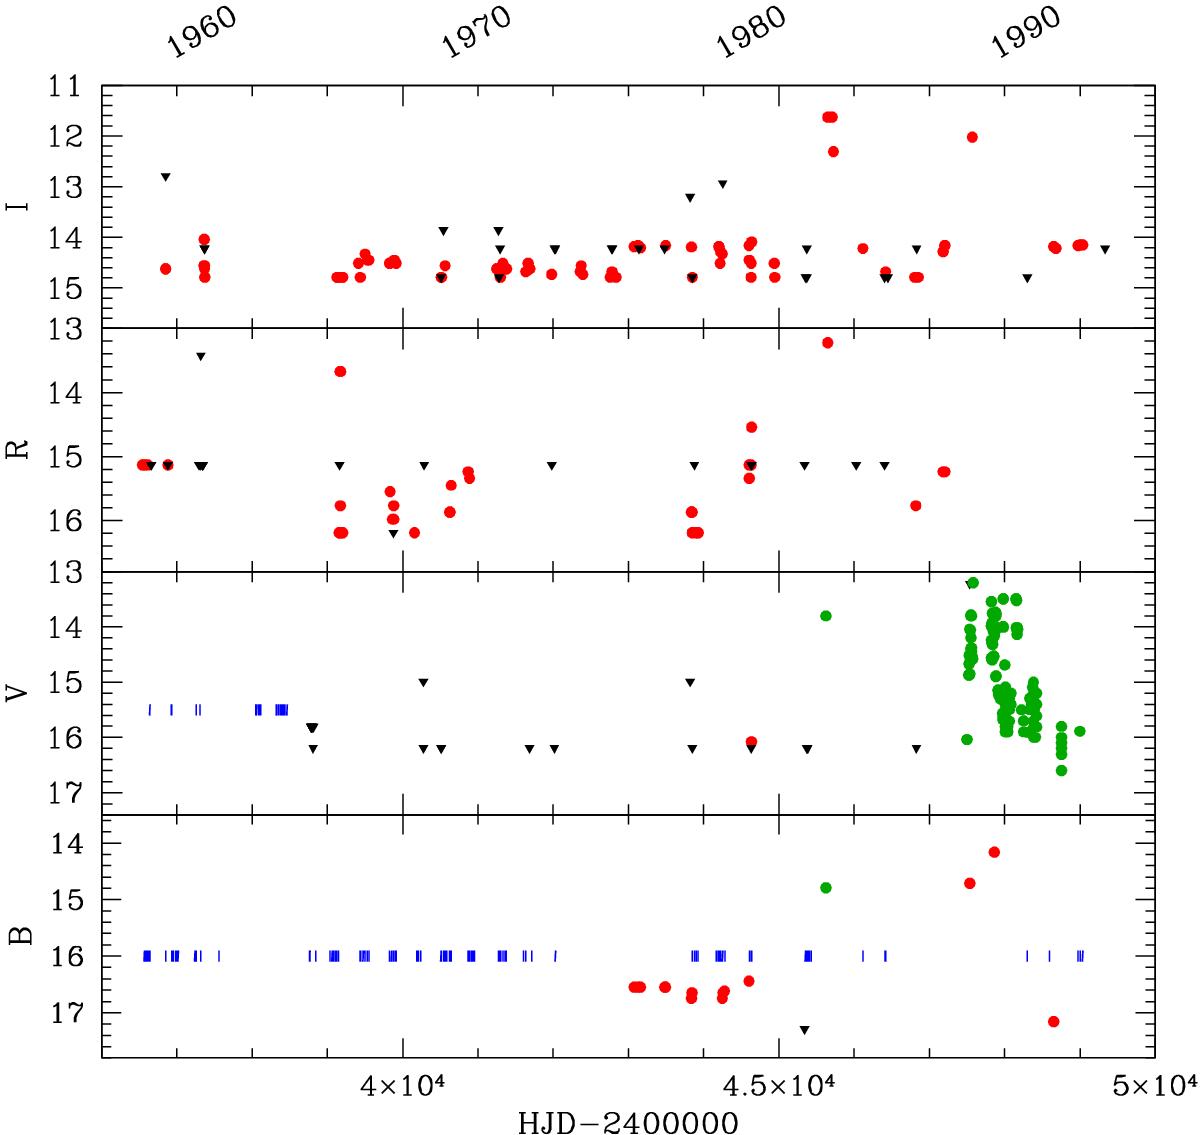
BVRI light curves of V1118 Ori. Upper limits are given as solid black triangles. In the two bottom panels (B and V), blue vertical bars indicate the dates when the nebular background around V1118 Ori was too bright (see text Sect. 2.2). Green points refer to literature measurements reported by Parsamian et al. (1993) and García García & Parsamian (2000).
Current usage metrics show cumulative count of Article Views (full-text article views including HTML views, PDF and ePub downloads, according to the available data) and Abstracts Views on Vision4Press platform.
Data correspond to usage on the plateform after 2015. The current usage metrics is available 48-96 hours after online publication and is updated daily on week days.
Initial download of the metrics may take a while.