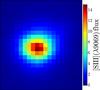
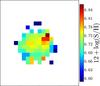
Fig. 8
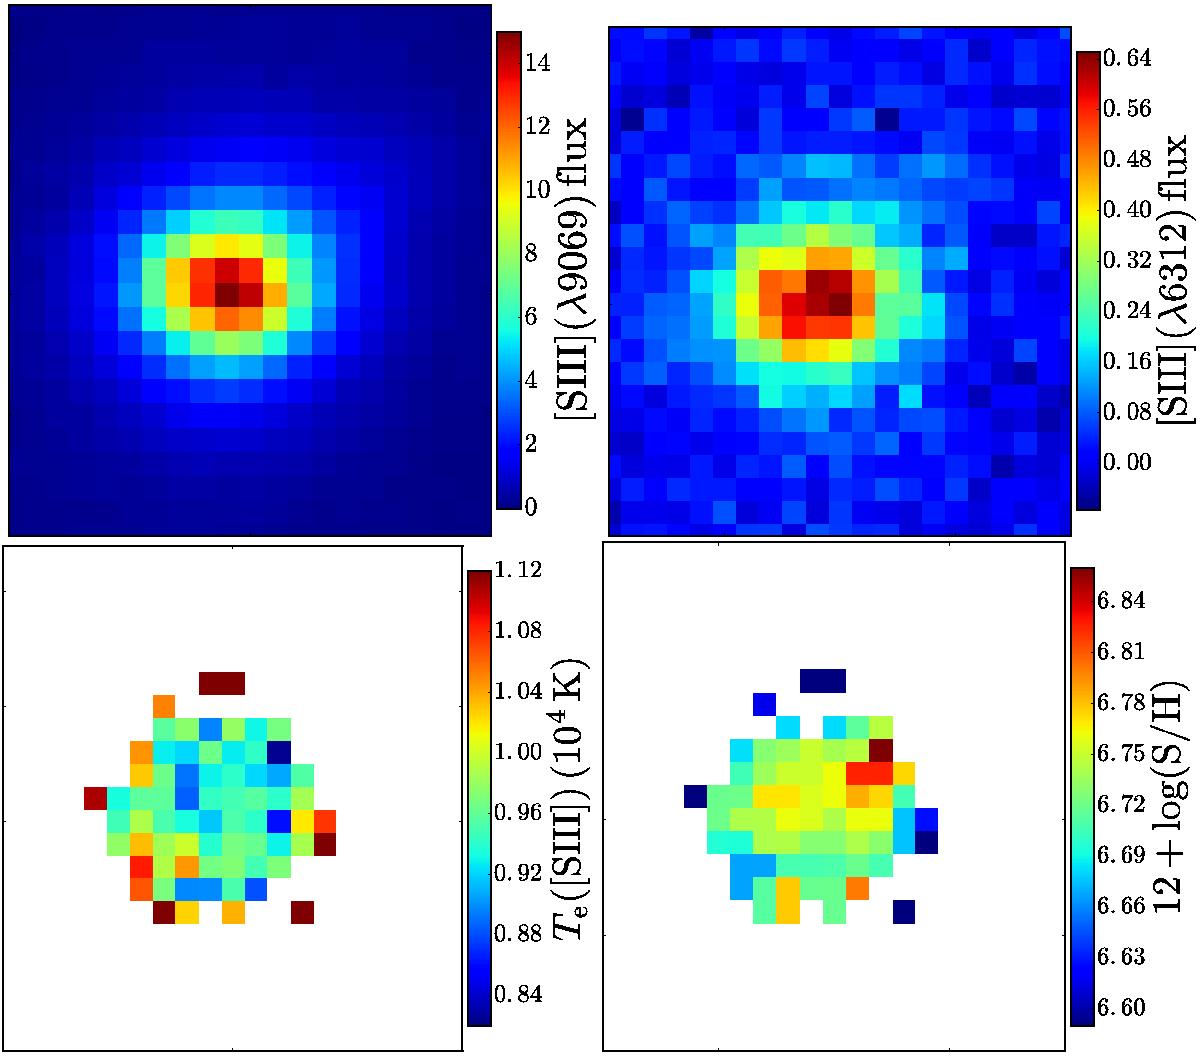
Electron temperatures (Te) from [S iii] and corresponding sulfur abundances in the WR region. Top left: flux map of nebular [S iii](λ9069). Top right: flux map of auroral [S iii](λ6312). Both flux maps are in units of 10-17 erg cm-2 s-1. Bottom left: electron temperatures from [S iii]. Bottom right: 12 + log (S / H) as derived from Te. The solar abundance [O/S] is 1.57 (Asplund et al. 2009), so the 12 + log (S / H) scale corresponds to 12 + log (O / H) = 8.2 to 8.4. All panels are approximately 6′′ by 6′′, or 1 kpc by 1 kpc.
Current usage metrics show cumulative count of Article Views (full-text article views including HTML views, PDF and ePub downloads, according to the available data) and Abstracts Views on Vision4Press platform.
Data correspond to usage on the plateform after 2015. The current usage metrics is available 48-96 hours after online publication and is updated daily on week days.
Initial download of the metrics may take a while.