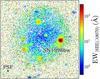
Fig. 4
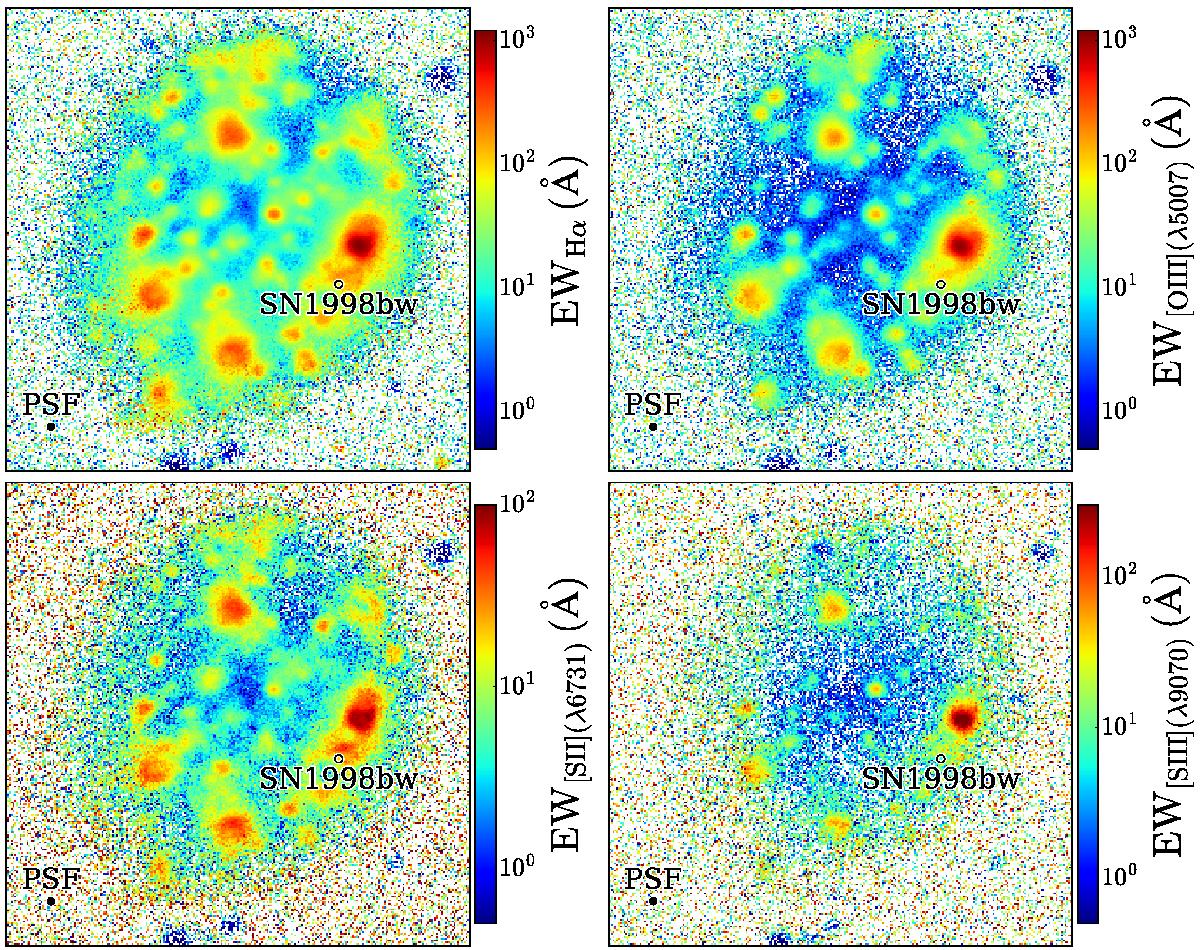
Reconstructed images from the MUSE data cube. Each panel shows the host of GRB 980425 in a different nebular line. Top left: Hα. Top right: [O iii](λ5007). Bottom left: [S ii](λ6731). Bottom right: [S iii](λ9070). All panels are approximately 55′′ by 55′′, or 10 kpc by 10 kpc at the GRB redshift. The effective spatial resolution is given by the point spread function (PSF) indicated in the lower left corner of each image with a full width half maximum (FWHM) of approximately 0.′′9 or 160 pc.
Current usage metrics show cumulative count of Article Views (full-text article views including HTML views, PDF and ePub downloads, according to the available data) and Abstracts Views on Vision4Press platform.
Data correspond to usage on the plateform after 2015. The current usage metrics is available 48-96 hours after online publication and is updated daily on week days.
Initial download of the metrics may take a while.