Fig. 3
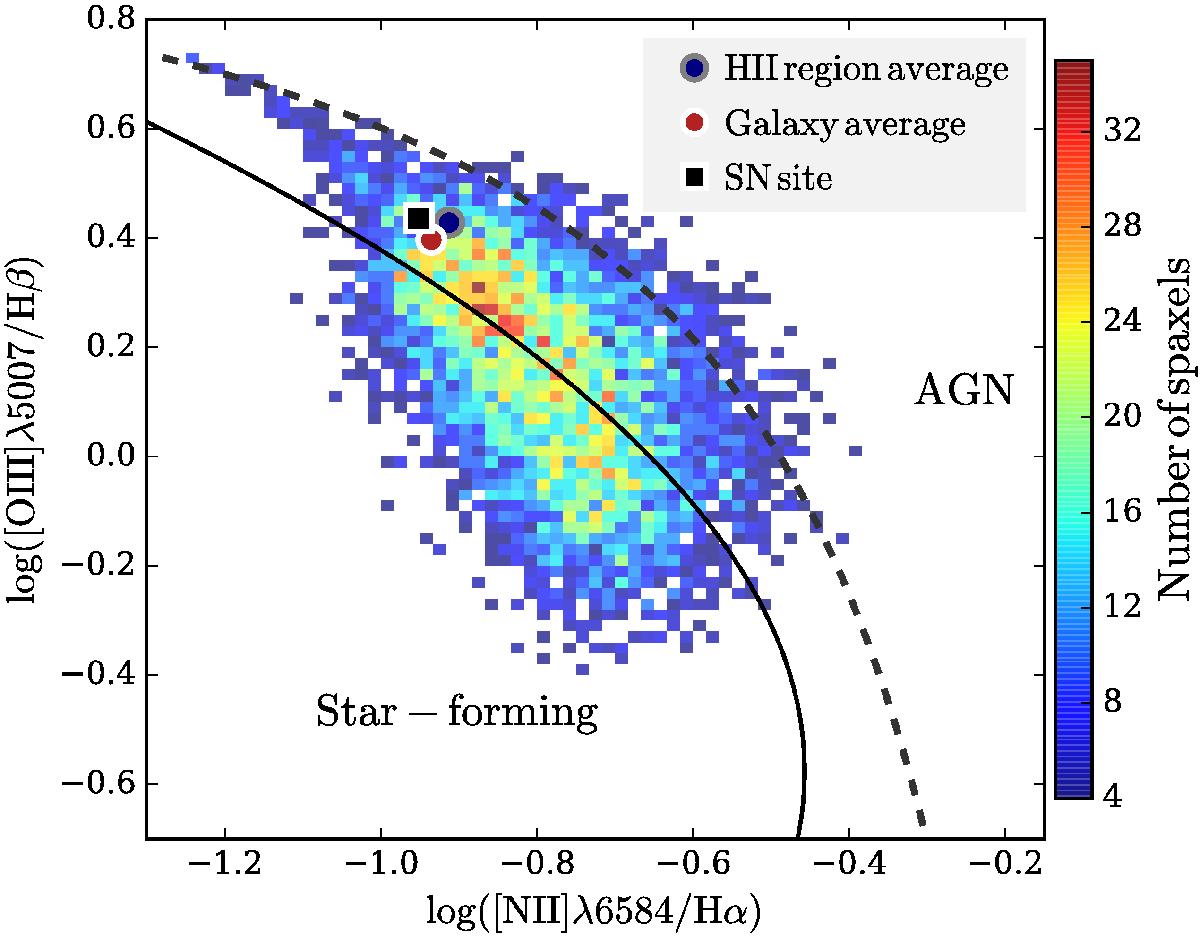
Spaxel BPT diagram for ESO184-G82. The solid line denotes the ridge line of SDSS galaxies (Brinchmann et al. 2008), whereas the dotted line represents the z = 0 classification line between star formation and AGN ionization (Kewley et al. 2013). The explosion site, a galaxy average (including all spaxels), and an H ii-region average (including only spaxels with EWHα> 10 Å) are indicated.
Current usage metrics show cumulative count of Article Views (full-text article views including HTML views, PDF and ePub downloads, according to the available data) and Abstracts Views on Vision4Press platform.
Data correspond to usage on the plateform after 2015. The current usage metrics is available 48-96 hours after online publication and is updated daily on week days.
Initial download of the metrics may take a while.