Fig. B.1
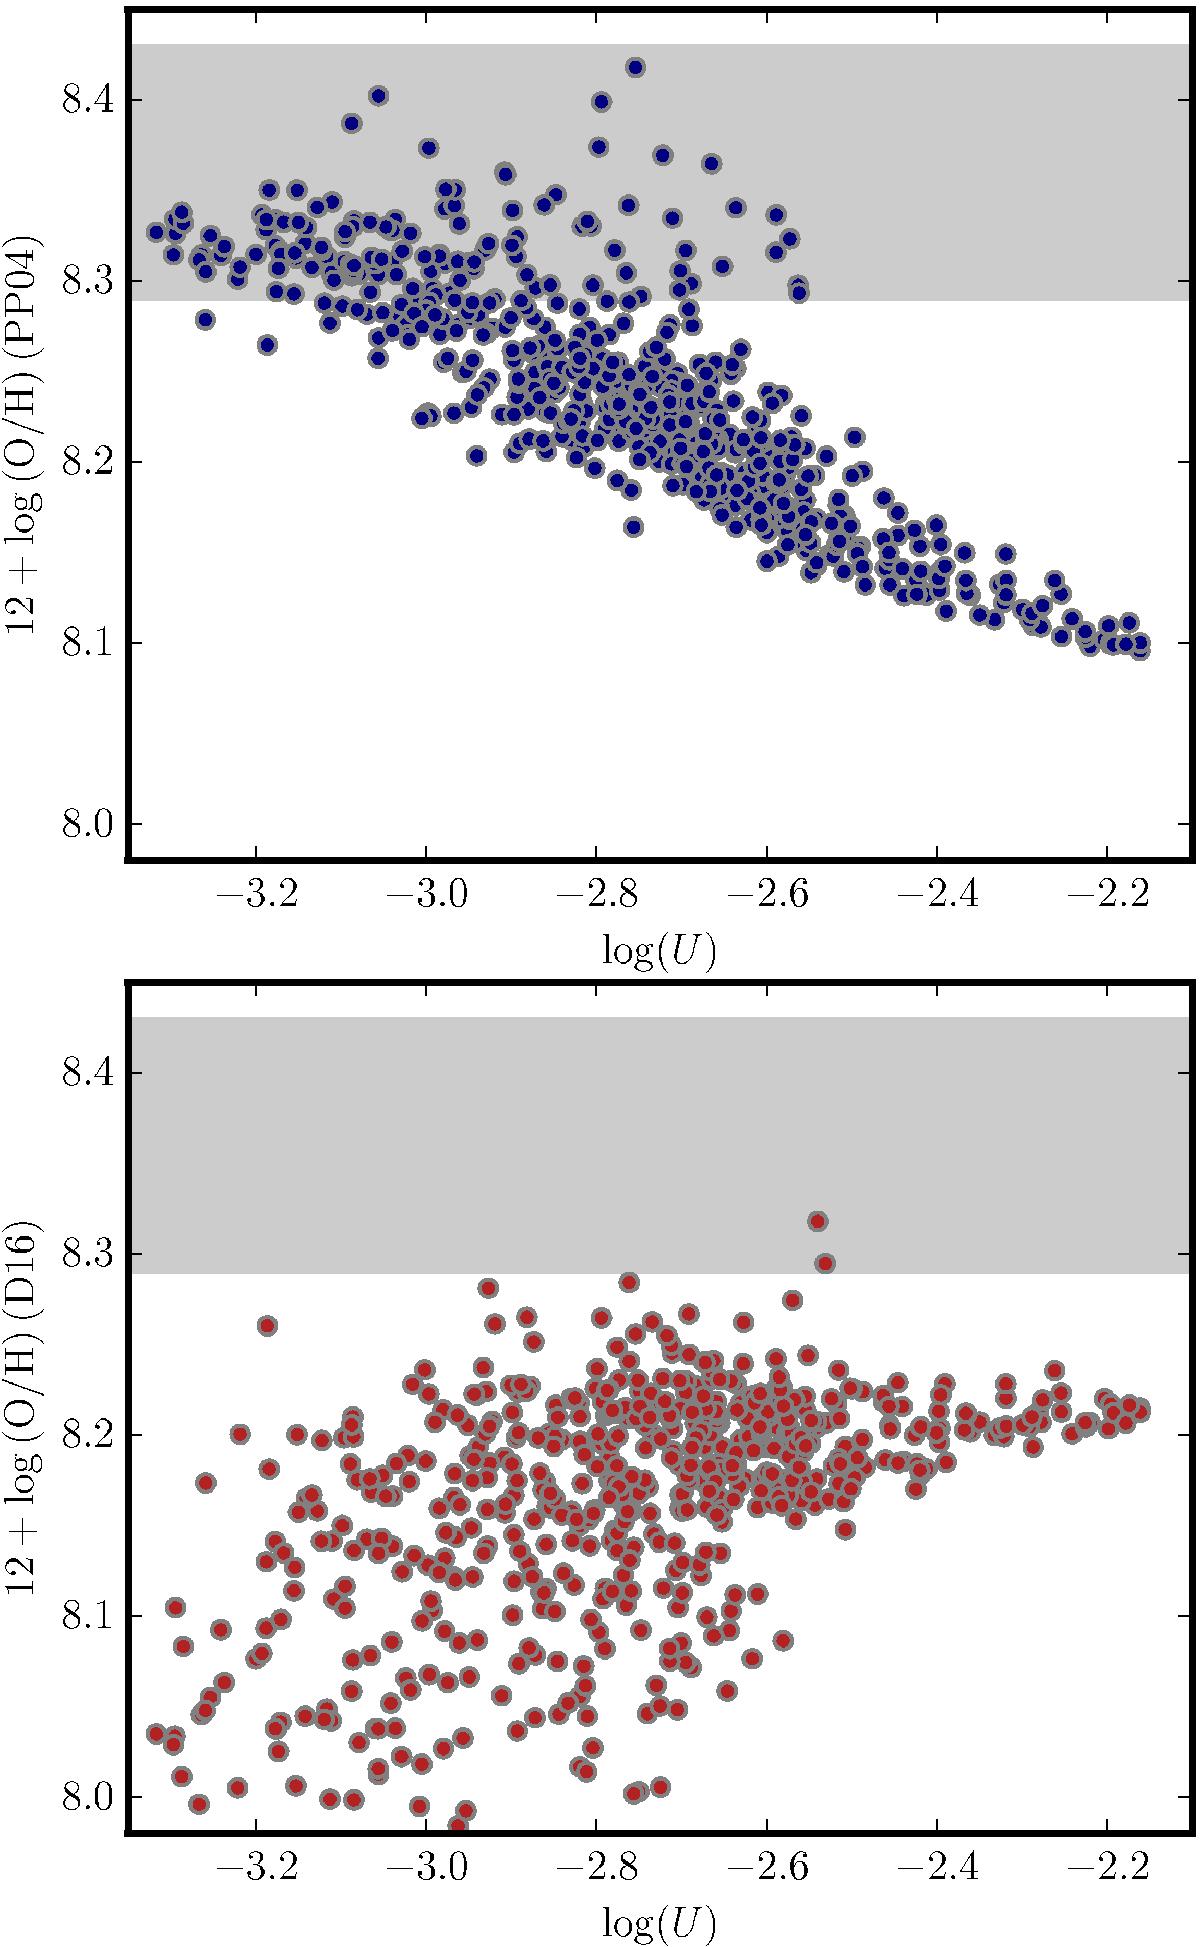
Dependence of the inferred oxygen abundance in two strong-line diagnostic ratios (upper panel: O3N2 from Pettini & Pagel 2004, lower panel: D16) on the ionization parameter U (from [S iii]/[S ii]) for the WR region. Each data point corresponds to a single spaxel and the grey region indicates the constraints from the temperature-sensitive [O iii](λ4363) emission line.
Current usage metrics show cumulative count of Article Views (full-text article views including HTML views, PDF and ePub downloads, according to the available data) and Abstracts Views on Vision4Press platform.
Data correspond to usage on the plateform after 2015. The current usage metrics is available 48-96 hours after online publication and is updated daily on week days.
Initial download of the metrics may take a while.