Free Access
Fig. A.1
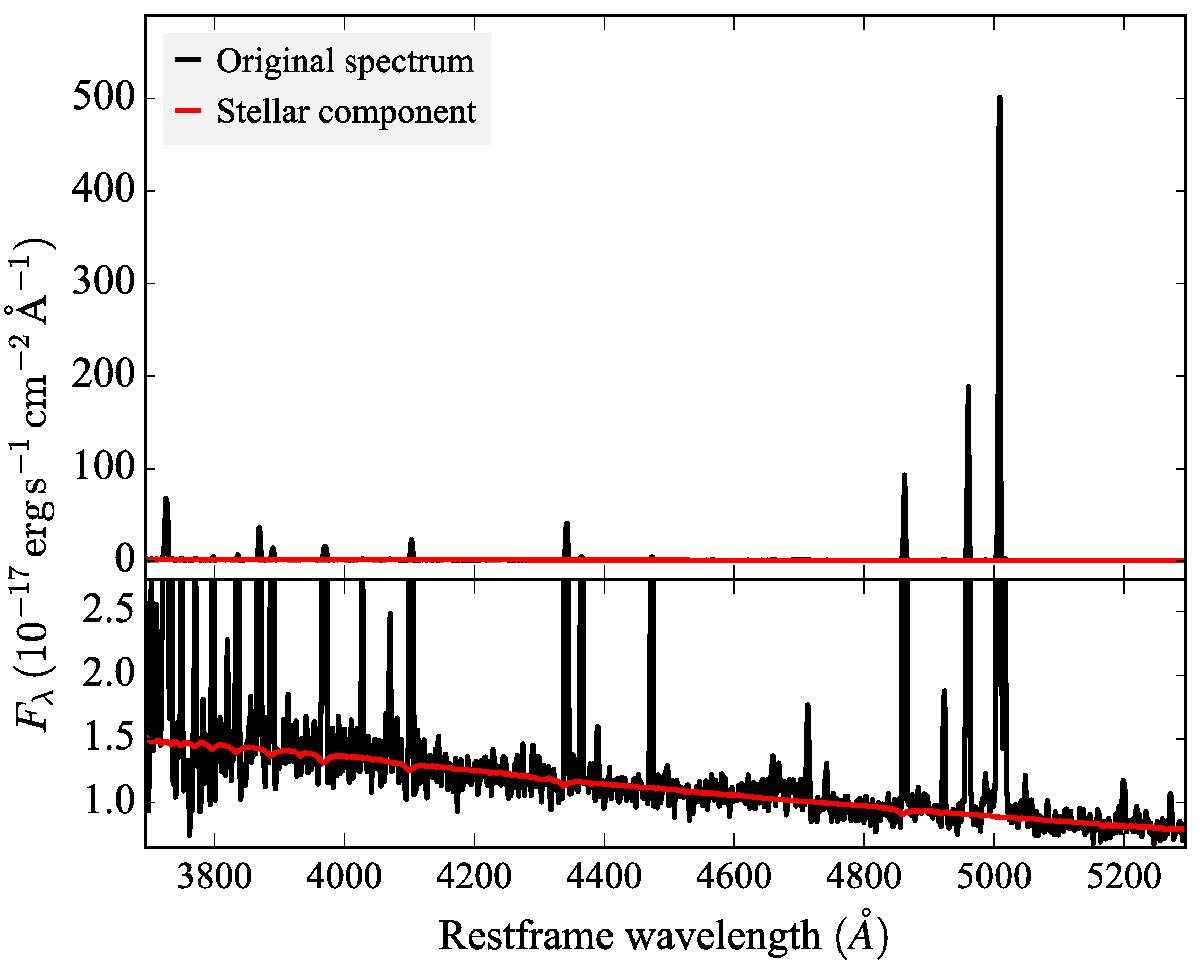
FORS2 600B spectrum of the brightest pixel of the WR region. Black is the original spectrum and red represents the fitted stellar component. The upper panel shows the full flux range, while the lower panel is a zoom into the stellar continuum.
Current usage metrics show cumulative count of Article Views (full-text article views including HTML views, PDF and ePub downloads, according to the available data) and Abstracts Views on Vision4Press platform.
Data correspond to usage on the plateform after 2015. The current usage metrics is available 48-96 hours after online publication and is updated daily on week days.
Initial download of the metrics may take a while.