Fig. 4
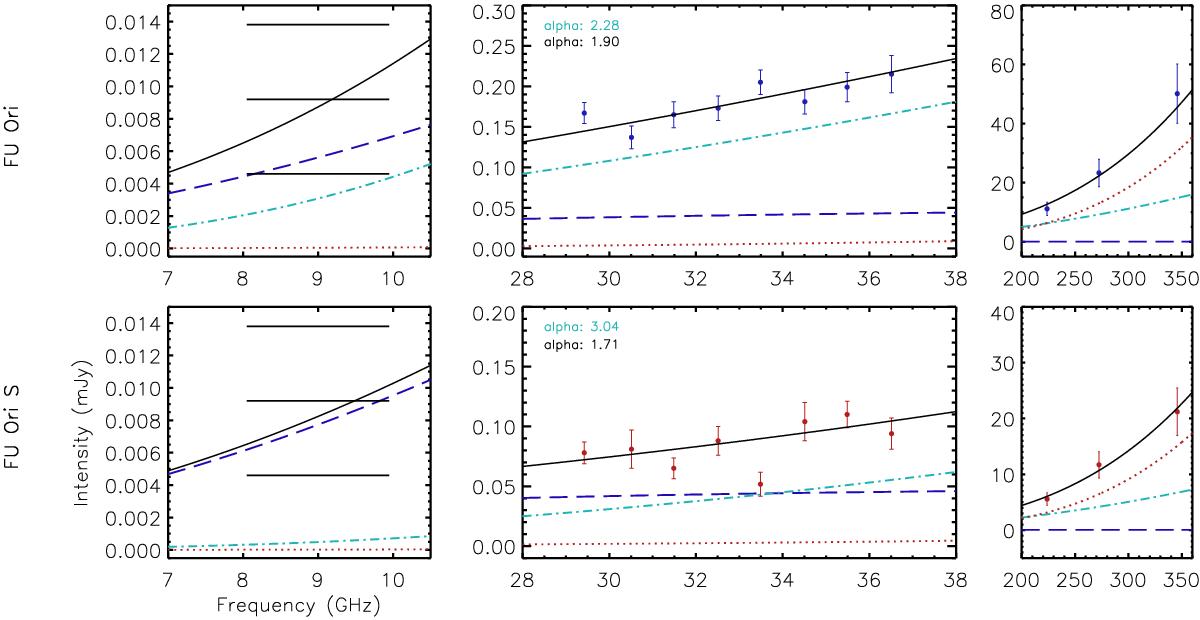
Fiducial SED models for FU Ori (upper) and FU Ori S (lower). Dotted lines show the fluxes of the optical thinner and cooler dust components; dashed-dotted lines show the fluxes of the optically thicker hot dust components; dashed lines show the fluxes of the ionized components; solid curves show the integrated fluxes. The horizontal bars in the left panels are the same as those in the bottom panel of Fig. 3. The plotted 224 GHz and 272 GHz data assume that the flux ratio between FU Ori and FU Ori S is identical to that at 33 GHz.
Current usage metrics show cumulative count of Article Views (full-text article views including HTML views, PDF and ePub downloads, according to the available data) and Abstracts Views on Vision4Press platform.
Data correspond to usage on the plateform after 2015. The current usage metrics is available 48-96 hours after online publication and is updated daily on week days.
Initial download of the metrics may take a while.