Fig. 3
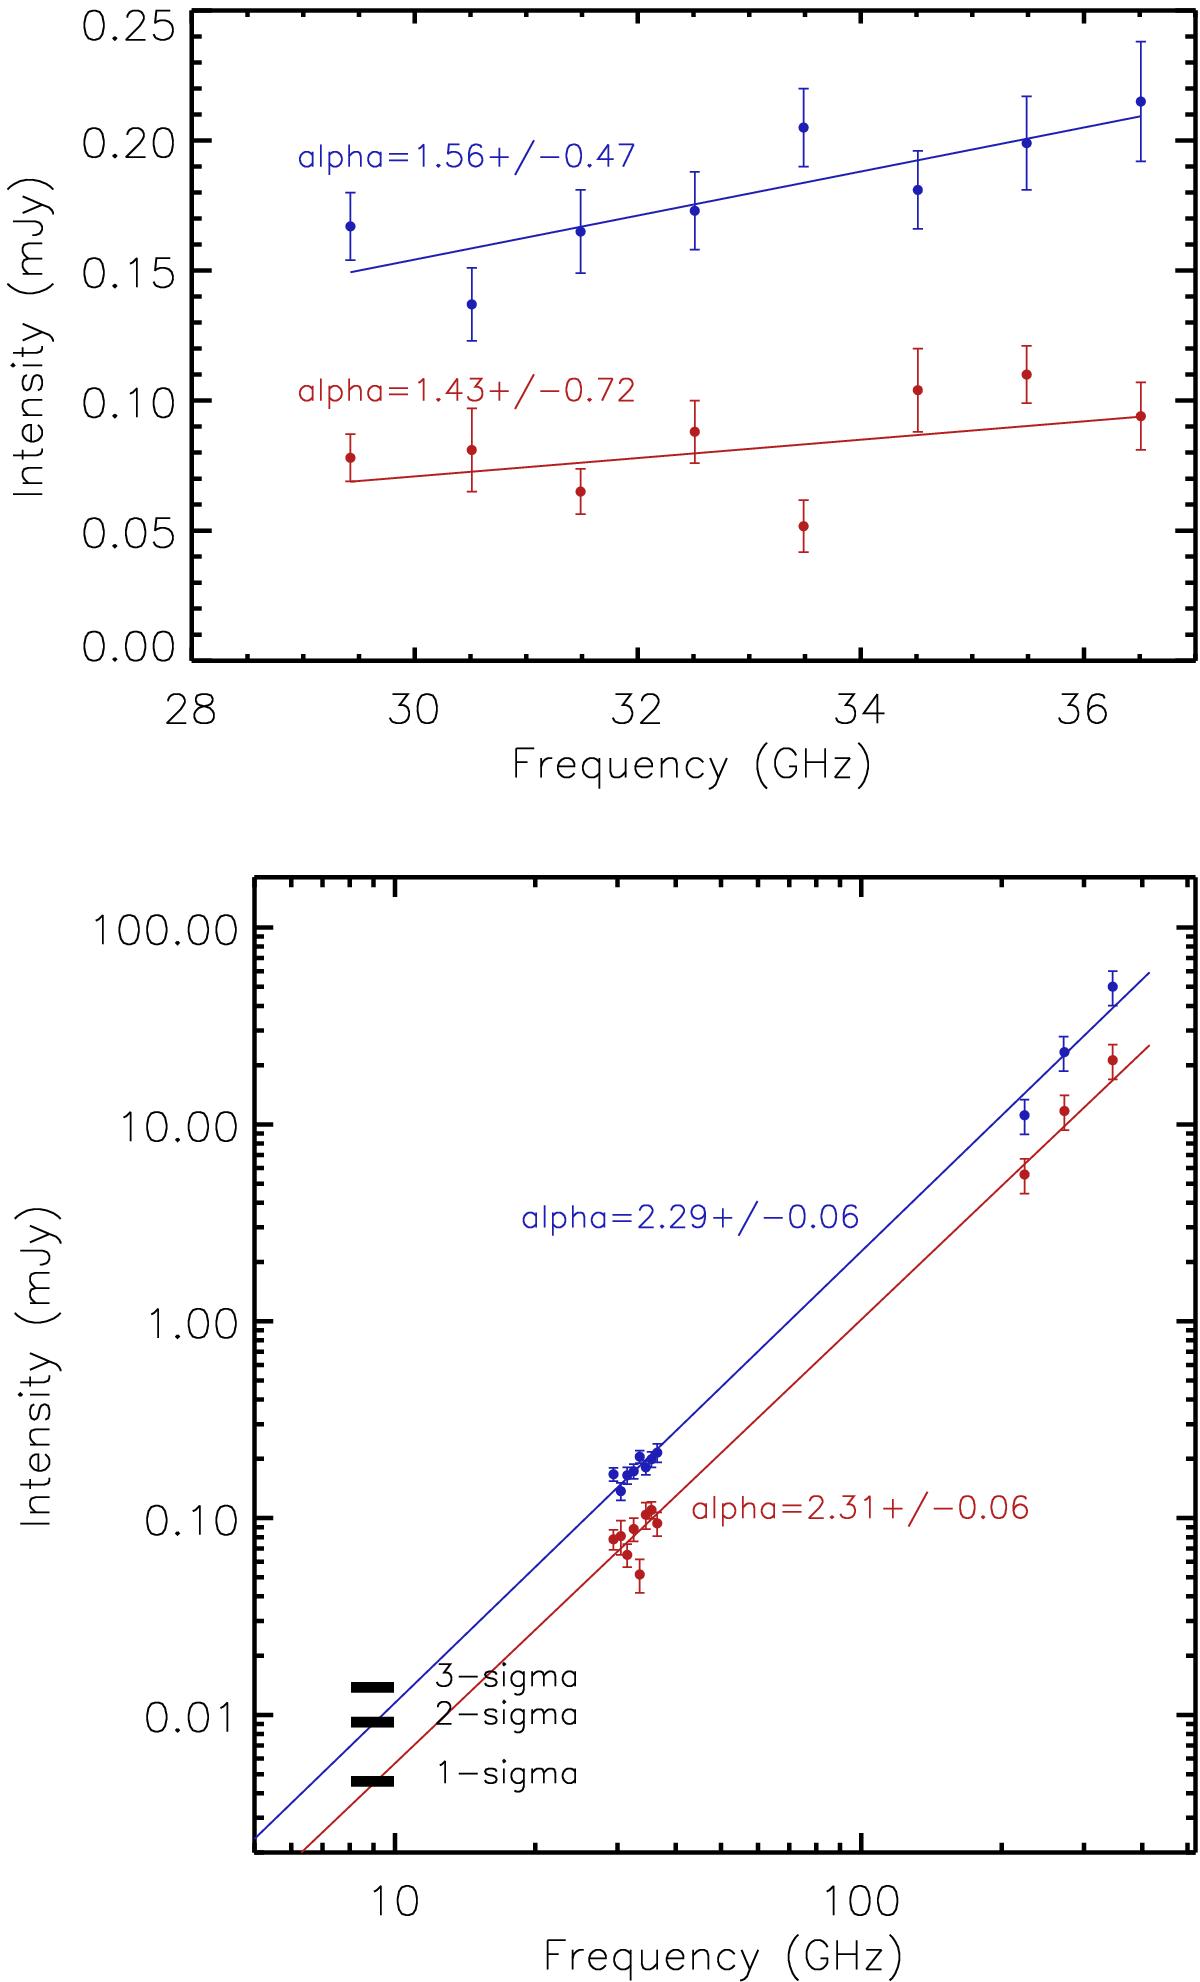
Observed fluxes from the two components, FU Ori and FU Ori S, resolved at 33 GHz (Fig. 1, right). Top: blue and red data points are the JVLA Ka band measurements around FU Ori and FU Ori S, respectively. Solid lines are regression curves to derive spectral indices (α). Bottom: a comparison of the measured fluxes from the JVLA X band (8–10 GHz) and Ka band (29–36 GHz), the SMA 224 GHz and 272 GHz, and the ALMA 345 GHz observations. The ALMA measurements were quoted from Hales et al. (2015). We do not obtain any significant detection with the observations of JVLA at X band (8–10 GHz) and provide here the 1–3σ upper limits. In the bottom panel, the plotted 224 GHz and 272 GHz data assume that the flux ratio between FU Ori and FU Ori S is identical to that at 33 GHz. We considered a ~20% nominal absolute flux error for the SMA and ALMA measurements. We caution that the 33 GHz, 224 GHz, 272 GHz, and 346 GHz data presented here were not observed with the same uv coverage.
Current usage metrics show cumulative count of Article Views (full-text article views including HTML views, PDF and ePub downloads, according to the available data) and Abstracts Views on Vision4Press platform.
Data correspond to usage on the plateform after 2015. The current usage metrics is available 48-96 hours after online publication and is updated daily on week days.
Initial download of the metrics may take a while.