Fig. 2
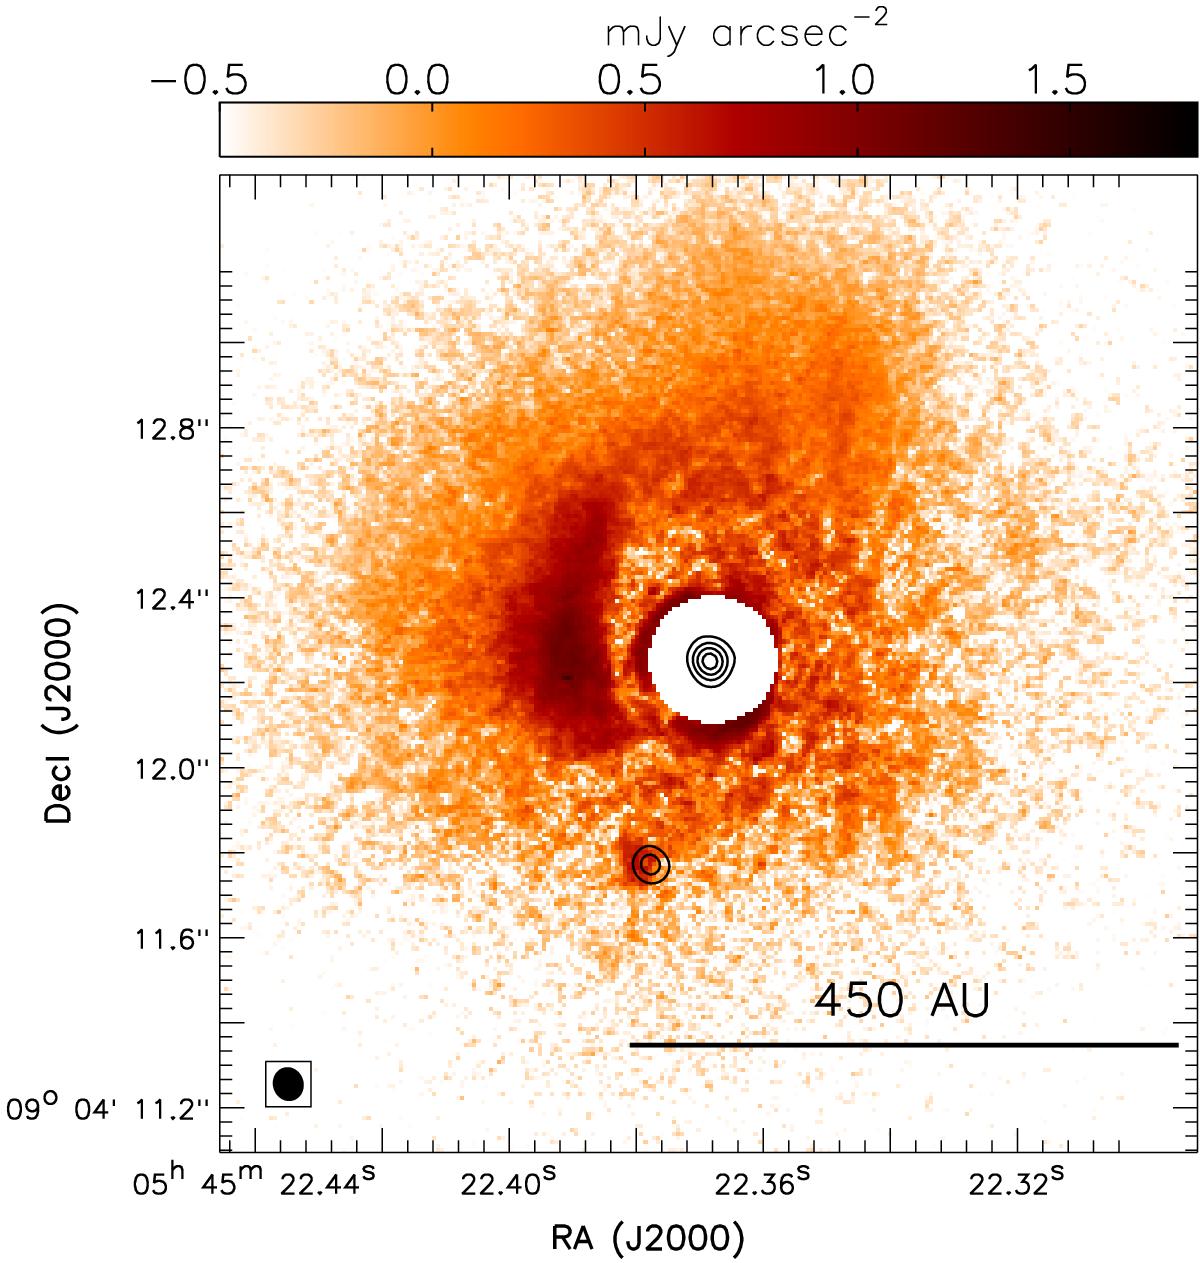
JVLA 33 GHz image (contour), overlaid with the Subaru-HiCIAO H-band (1.6 μm) polarized intensity image (color; see Liu et al. 2016b). The synthesized beam of the JVLA observations is plotted in bottom left. Contour levels are 36 μJy beam-1 (10σ) × [1, 2, 3, 4, 5]. The central 0![]() 3 region of the Subaru-HiCIAO image is masked due to the obscuration of the coronagraph. We assume a distance of 353 pc, which is different from the distance quoted in Liu et al. (2016b).
3 region of the Subaru-HiCIAO image is masked due to the obscuration of the coronagraph. We assume a distance of 353 pc, which is different from the distance quoted in Liu et al. (2016b).
Current usage metrics show cumulative count of Article Views (full-text article views including HTML views, PDF and ePub downloads, according to the available data) and Abstracts Views on Vision4Press platform.
Data correspond to usage on the plateform after 2015. The current usage metrics is available 48-96 hours after online publication and is updated daily on week days.
Initial download of the metrics may take a while.