Fig. 1
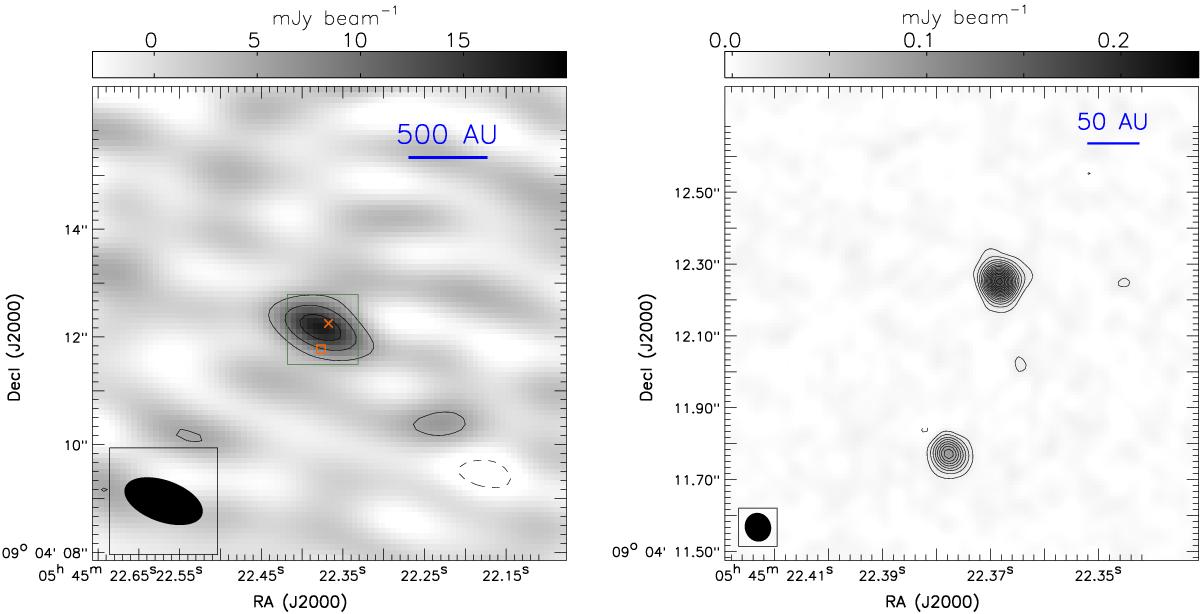
Interferometric images of FU Ori (contour and grayscale). Left: SMA 224 GHz image. Contour levels are 4.8 mJy beam-1 (3σ) × [−2, −1, 1, 2, 3]. Right: JVLA 29–37 GHz image. Contour levels are 10.8 μJy beam-1 (3σ) × [−2, −1, 1, 2, 3, 4, ···, 13, 14, 15]. Dashed contours present negative intensity. Cross and square in the left panel mark the locations of FU Ori and FU Ori S, which were obtained from the two-dimensional Gaussian fits to the JVLA 33 GHz image. Green box in the left panel shows the field of view of the right panel. We assume a distance of 353 pc.
Current usage metrics show cumulative count of Article Views (full-text article views including HTML views, PDF and ePub downloads, according to the available data) and Abstracts Views on Vision4Press platform.
Data correspond to usage on the plateform after 2015. The current usage metrics is available 48-96 hours after online publication and is updated daily on week days.
Initial download of the metrics may take a while.