Fig. 12
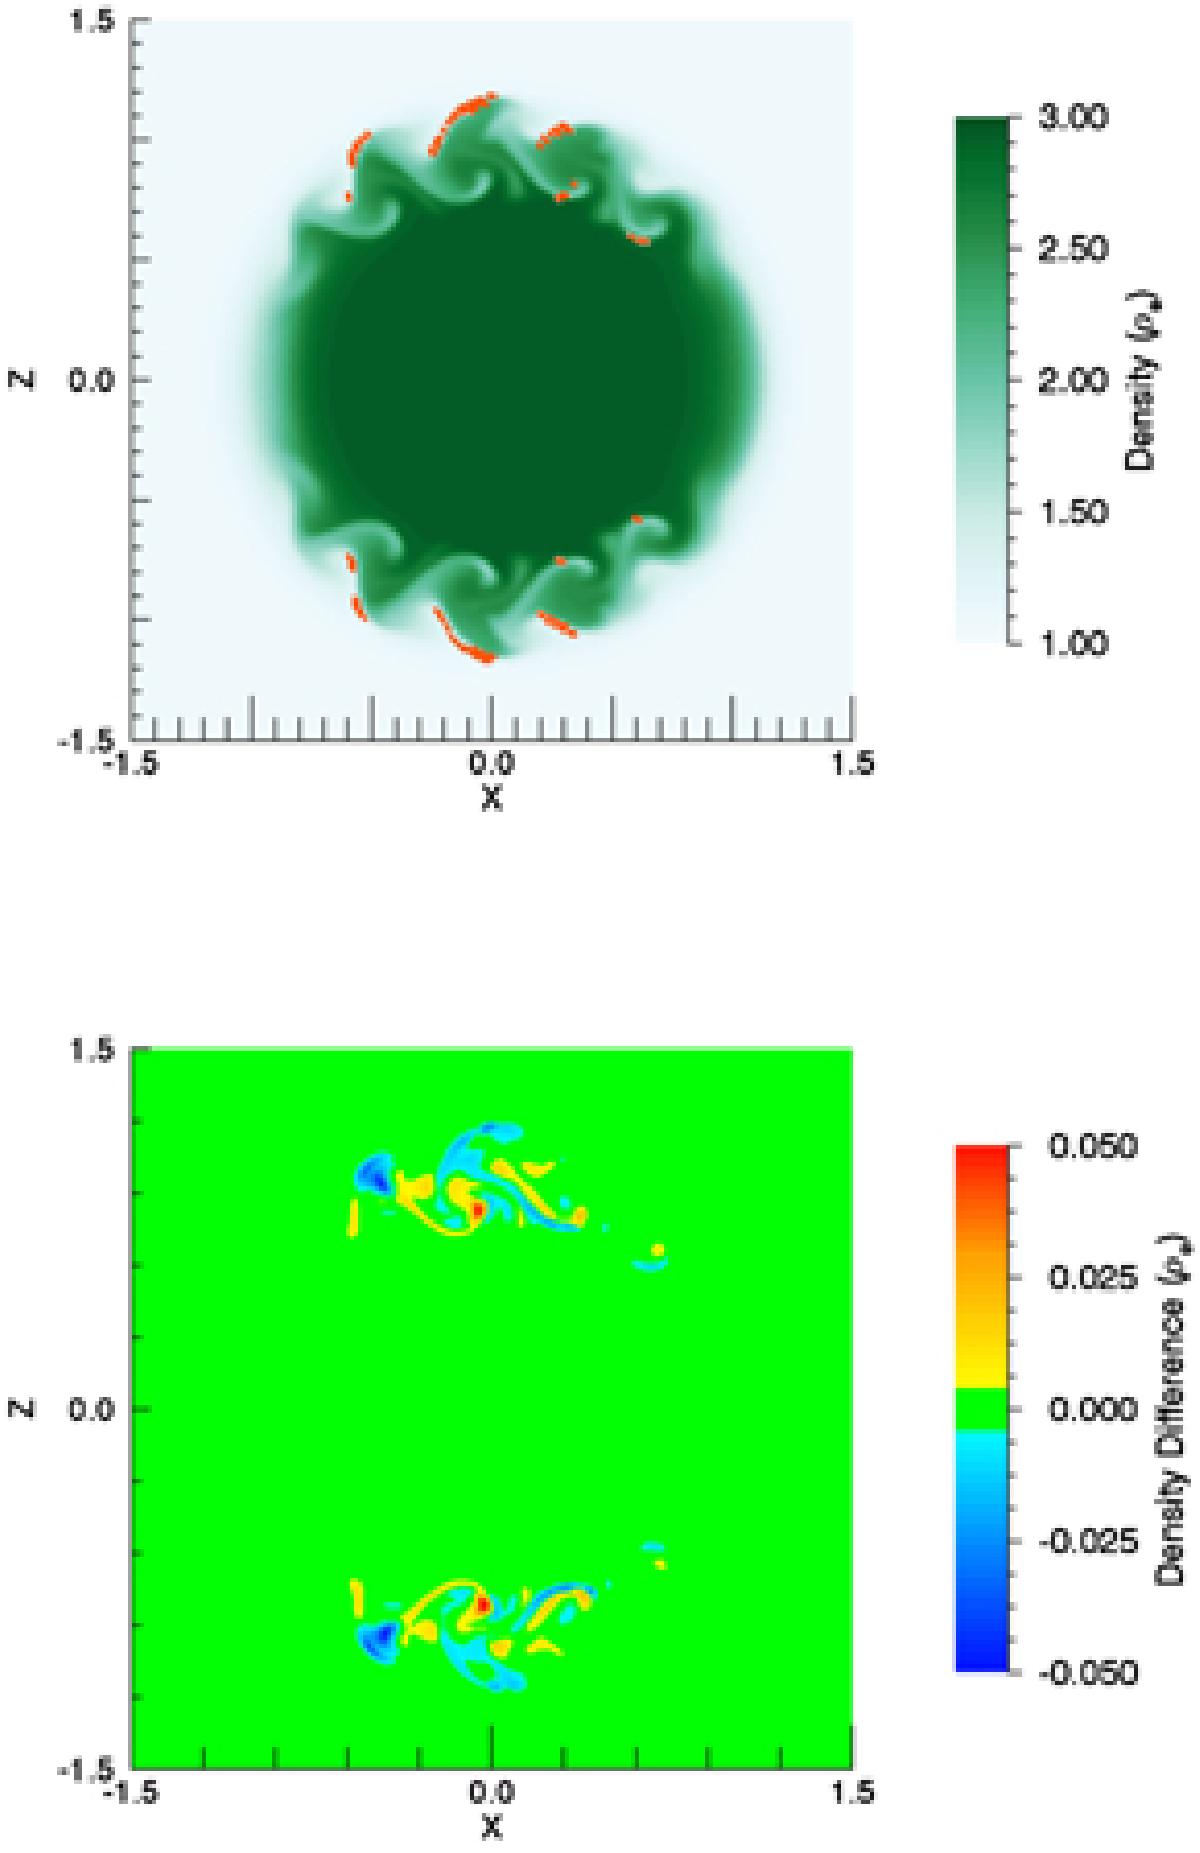
Upper panel: density profile in the cross-section at the loop apex for the simulation with ![]() and a critical resistivity, η∗ = 10-4. As in Fig. 3, the density is normalised to the initial exterior density, ρe. Regions in which the critical resistivity, is triggered are overplotted in red. Lower panel: difference plot between the density in the
and a critical resistivity, η∗ = 10-4. As in Fig. 3, the density is normalised to the initial exterior density, ρe. Regions in which the critical resistivity, is triggered are overplotted in red. Lower panel: difference plot between the density in the ![]() simulation and the simulation where η∗ is considered. Red regions indicate larger densities in the simulation including η∗ and blue regions indicate larger densities in the original case.
simulation and the simulation where η∗ is considered. Red regions indicate larger densities in the simulation including η∗ and blue regions indicate larger densities in the original case.
Current usage metrics show cumulative count of Article Views (full-text article views including HTML views, PDF and ePub downloads, according to the available data) and Abstracts Views on Vision4Press platform.
Data correspond to usage on the plateform after 2015. The current usage metrics is available 48-96 hours after online publication and is updated daily on week days.
Initial download of the metrics may take a while.