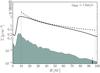
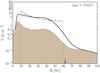
Fig. 7
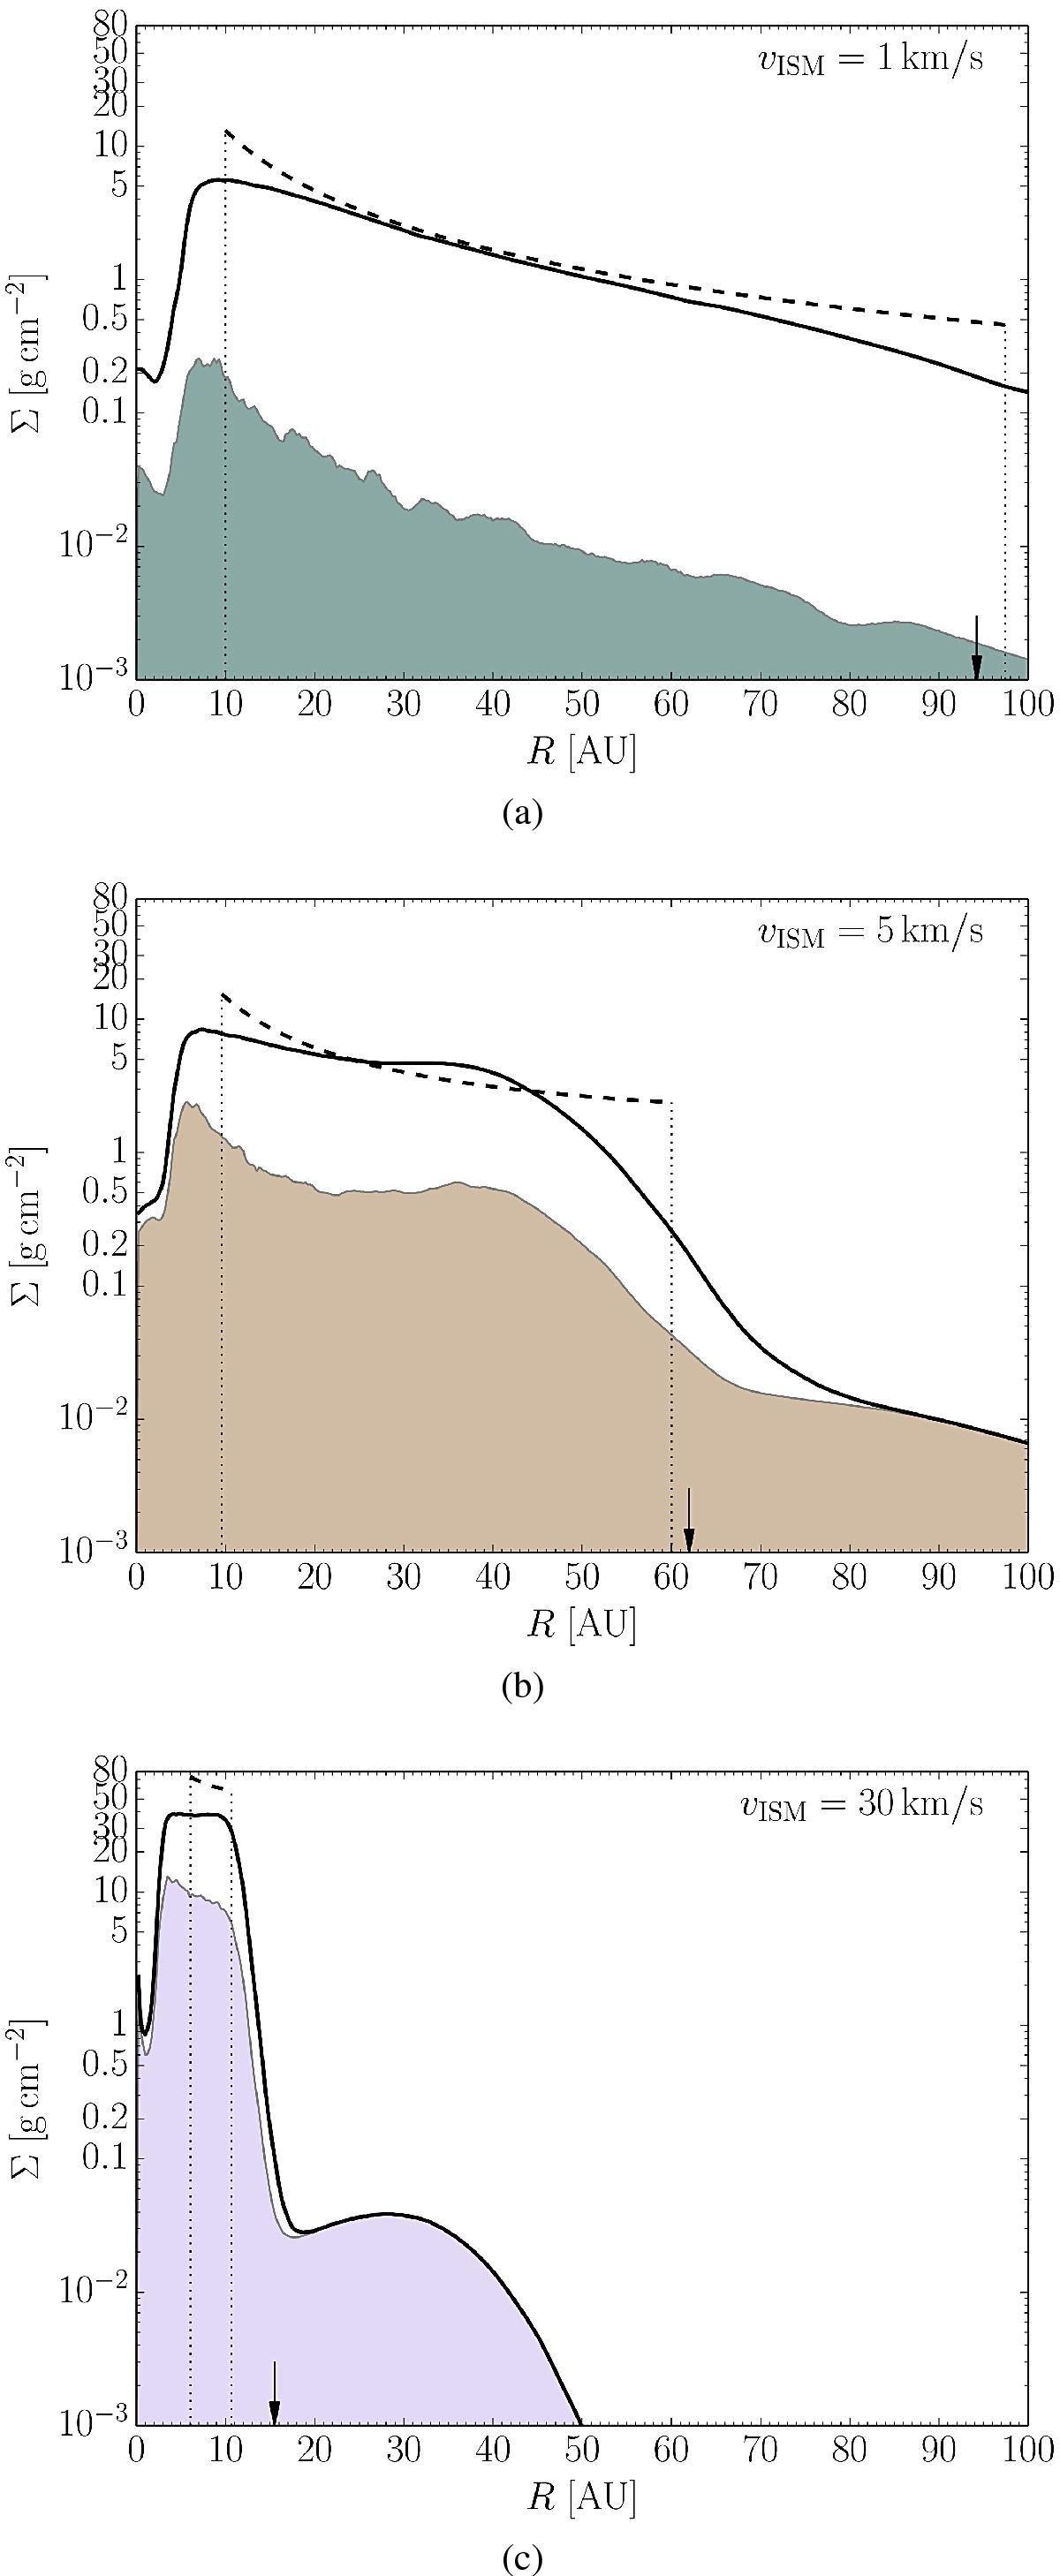
Surface density profile at the end of each simulation (solid line) and as predicted by our model (dashed line) for simulations a) V1N4, b V5N5, and c) V30N6. The dotted vertical lines indicate the inner and outer radius of the disc according to our model and the arrow indicates the radius of the disc as defined in the simulation. The shaded area illustrates the contribution of the ISM to the surface density profile, where the colour corresponds to the density: green indicates 1.9 × 10⁻¹⁹, brown 1.9 × 10⁻¹⁸, and purple 1.9 × 10⁻¹⁷ g/cm3.

Current usage metrics show cumulative count of Article Views (full-text article views including HTML views, PDF and ePub downloads, according to the available data) and Abstracts Views on Vision4Press platform.
Data correspond to usage on the plateform after 2015. The current usage metrics is available 48-96 hours after online publication and is updated daily on week days.
Initial download of the metrics may take a while.