Fig. 6
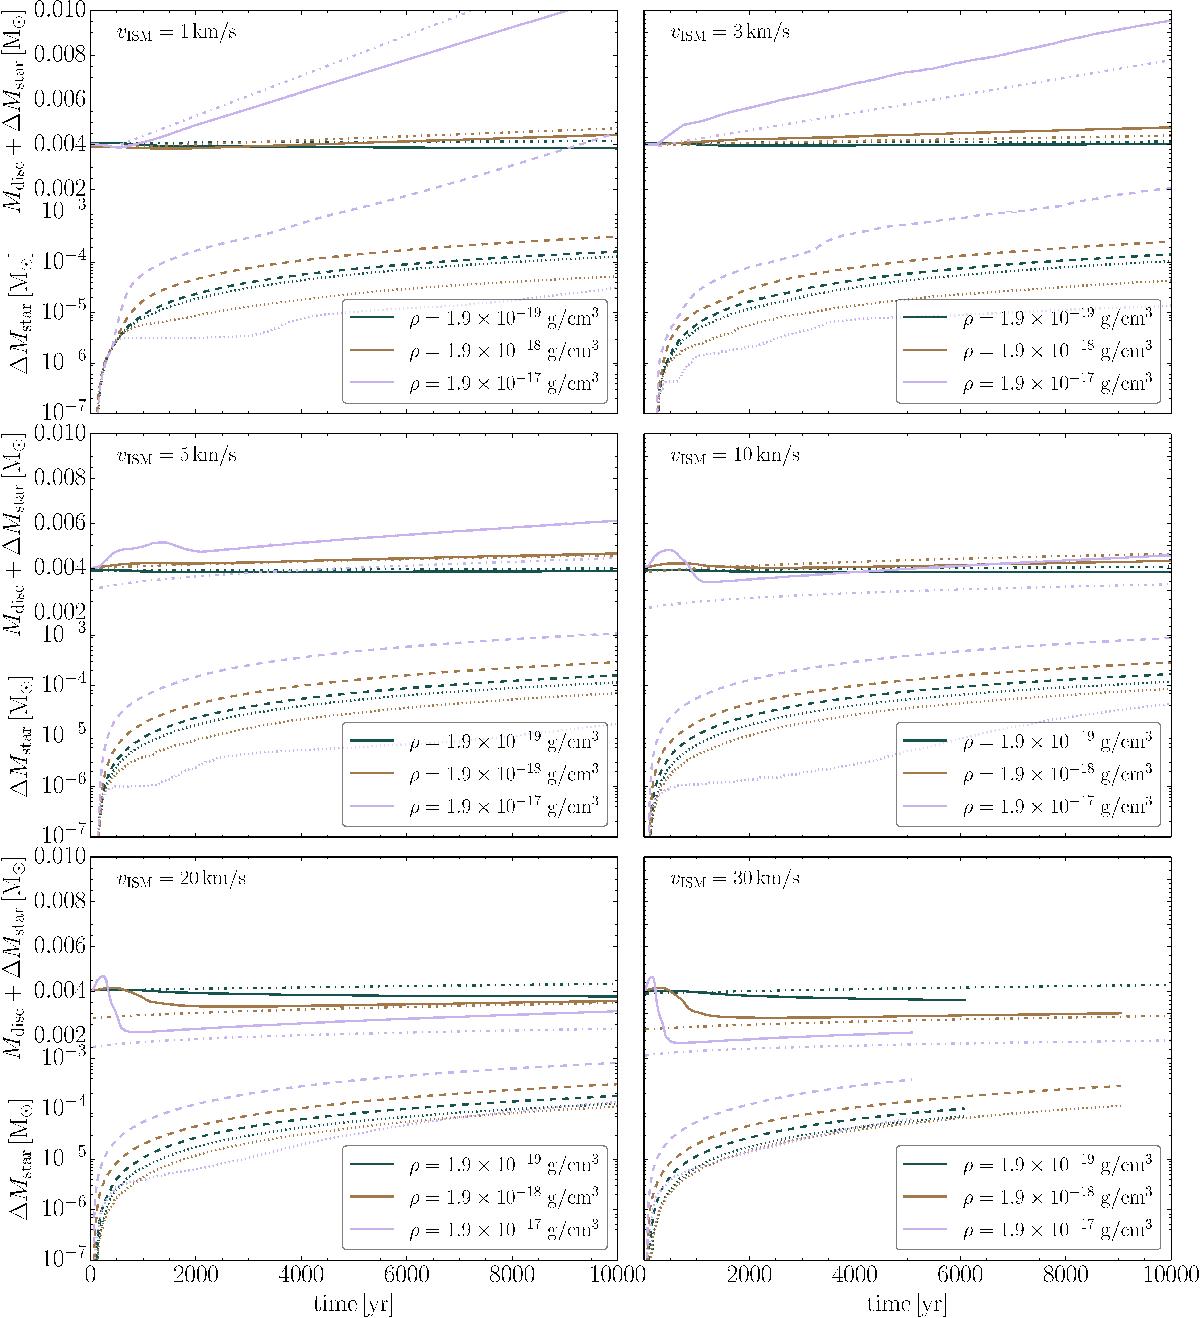
Top part of each panel shows the mass of the disc to which we added the total amount of material accreted onto the star as a function of time (solid lines) categorized by the velocity of the ISM in the simulation. The colour coding is as in Fig. 3. Our theoretical estimate of the same quantity (see Sect. 4.3) is given by the dash-dotted lines in corresponding colours. The bottom part of each panel shows the total amount of material accreted onto the star in dashed lines with the corresponding colour. The dotted lines give the amount of initial disc material that is accreted onto the star. The y-scale is continuous because all quantities have the same unit.
Current usage metrics show cumulative count of Article Views (full-text article views including HTML views, PDF and ePub downloads, according to the available data) and Abstracts Views on Vision4Press platform.
Data correspond to usage on the plateform after 2015. The current usage metrics is available 48-96 hours after online publication and is updated daily on week days.
Initial download of the metrics may take a while.