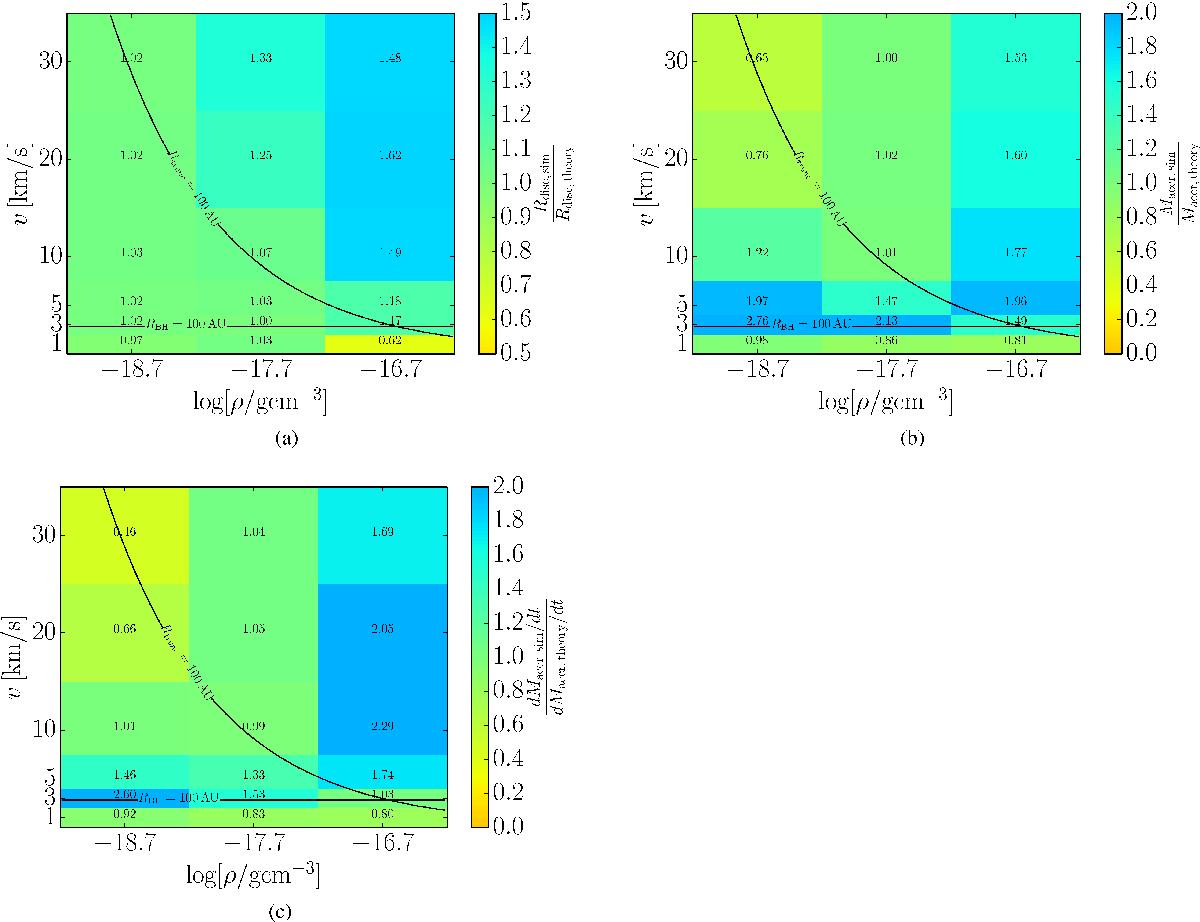
Fig. 5

Measures of the performance of our theoretical model. a) The radius of the disc at the end of the simulation divided by the predicted radius at that time. b) The amount of ISM accreted by the disc and star at the end of the simulation divided by the theoretically expected value at that time. To calculate the expected amount, we added the additional contribution of Bondi-Hoyle accretion from the moment the Bondi-Hoyle rate is higher than the geometric rate. c) The accretion rate at the end of the simulation divided by the theoretically expected rate at that time. Here we took the maximum of the geometric and Bondi-Hoyle accretion rate at each moment and averaged both the theoretical and simulated values over the last 1000 yr of the simulation. The lines indicate the regime where the Bondi-Hoyle radius and truncation radius are larger (below) and smaller (above), respectively, than the initial radius of the disc (see Sect. 4.1). The values in the grid cells correspond to the colour coding.
Current usage metrics show cumulative count of Article Views (full-text article views including HTML views, PDF and ePub downloads, according to the available data) and Abstracts Views on Vision4Press platform.
Data correspond to usage on the plateform after 2015. The current usage metrics is available 48-96 hours after online publication and is updated daily on week days.
Initial download of the metrics may take a while.


