Fig. 4
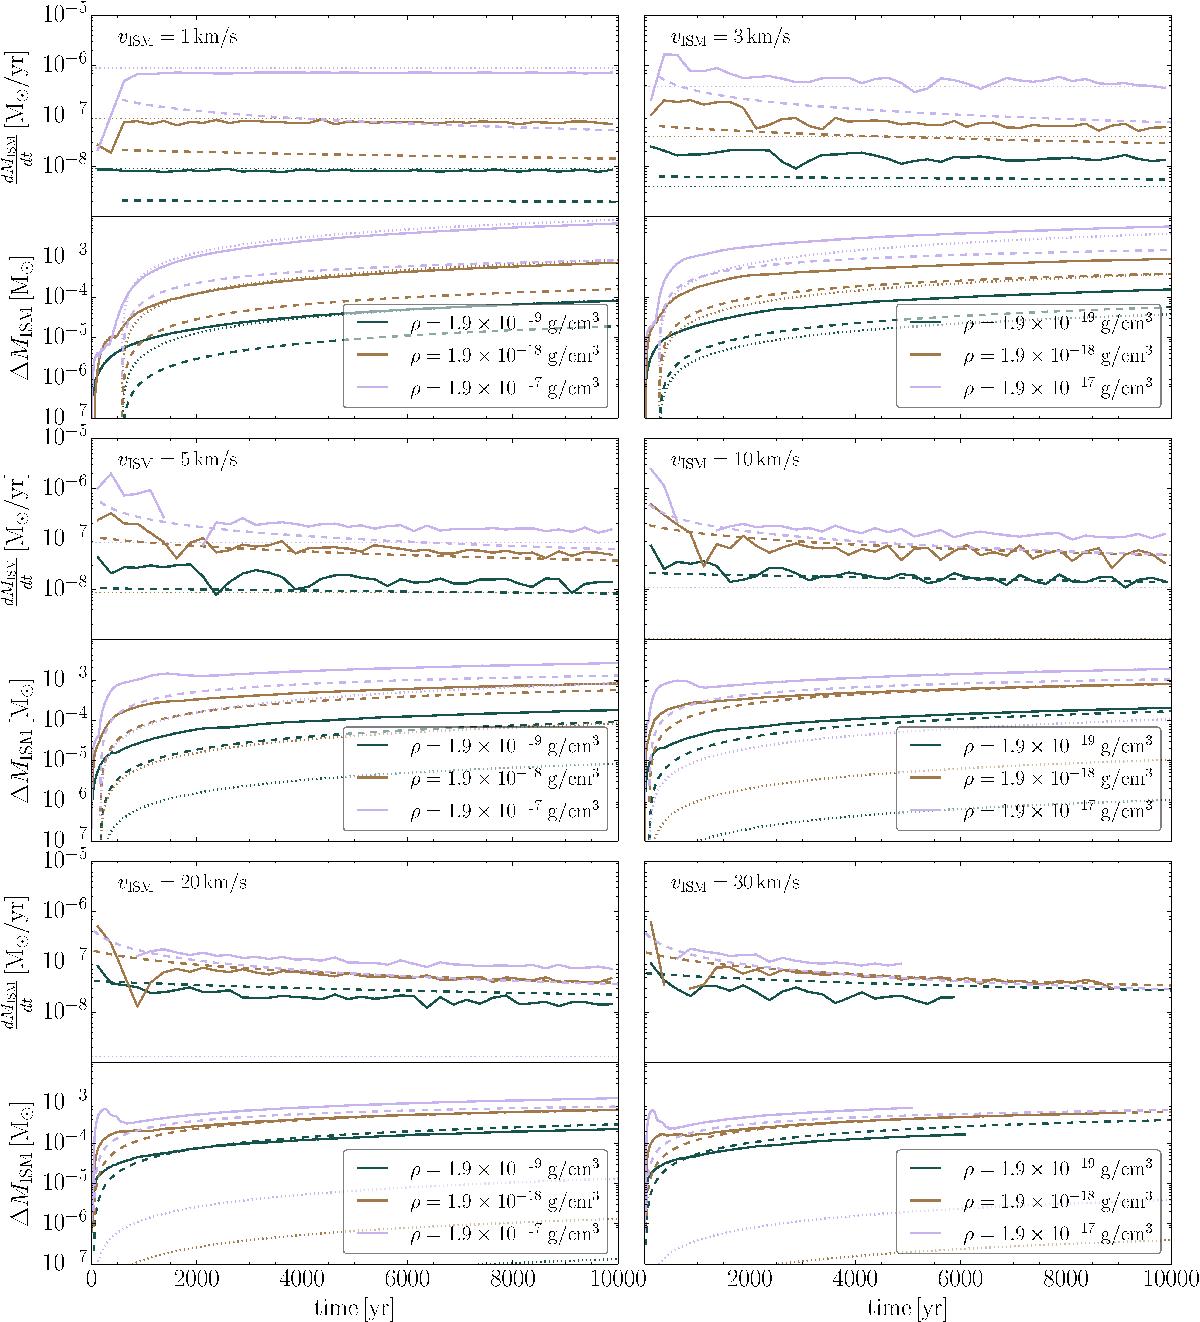
Upper half of each panel shows the accretion rates as a function of time found in our simulations (solid), expected from our theoretical model (dashed) and expected from Bondi-Hoyle accretion (dotted), respectively. The colour coding is as in Fig. 3. These rates are the derived from the quantity in the lower half of the panel, which is the cumulative amount of ISM accreted by the disc and star (solid lines). Our theoretical estimate based on the size of the disc (see Eq. (19)) is given by the dashed lines. The amount of accreted ISM expected from Bondi-Hoyle accretion is shown in dotted lines.
Current usage metrics show cumulative count of Article Views (full-text article views including HTML views, PDF and ePub downloads, according to the available data) and Abstracts Views on Vision4Press platform.
Data correspond to usage on the plateform after 2015. The current usage metrics is available 48-96 hours after online publication and is updated daily on week days.
Initial download of the metrics may take a while.