Fig. 3
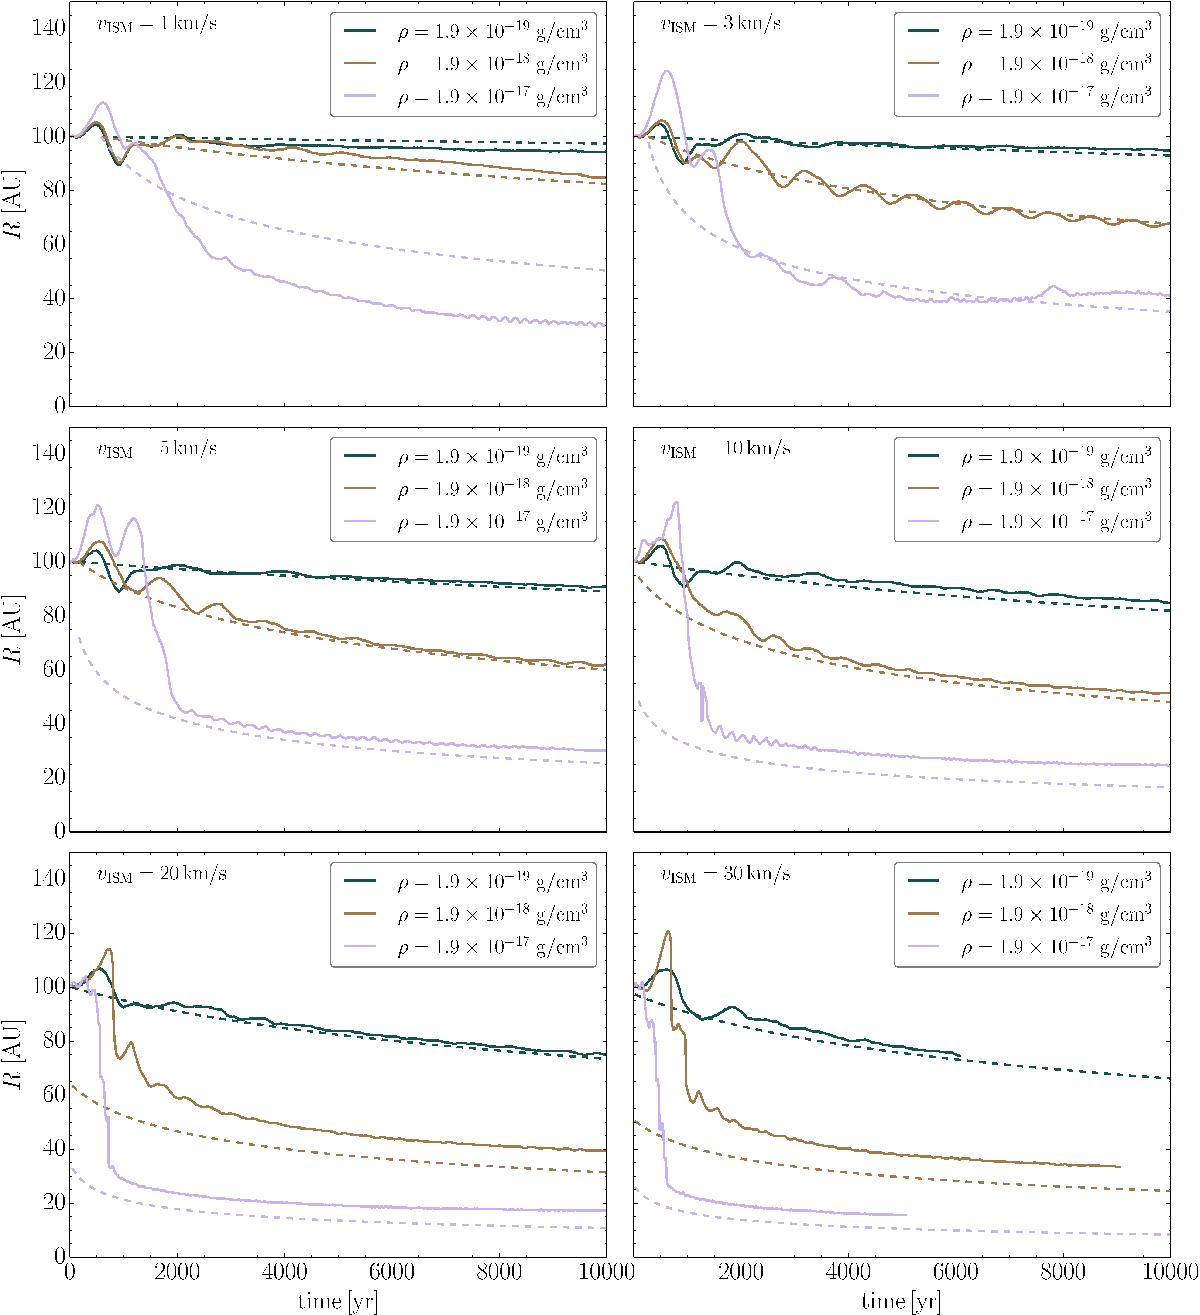
Disc radius (solid lines) as a function of time categorized by the velocity of the ISM in the simulation. The colour coding indicates the ISM density: green indicates 1.9 × 10⁻¹⁹, brown 1.9 × 10⁻¹⁸, and purple 1.9 × 10⁻¹⁷ g/cm3. The dashed lines in corresponding colours give our theoretical estimates of the disc radius (see Sect. 2.2). The simulations with vISM = 30 km s-1 were computationally expensive and have not reached 10 000 yr.
Current usage metrics show cumulative count of Article Views (full-text article views including HTML views, PDF and ePub downloads, according to the available data) and Abstracts Views on Vision4Press platform.
Data correspond to usage on the plateform after 2015. The current usage metrics is available 48-96 hours after online publication and is updated daily on week days.
Initial download of the metrics may take a while.