Free Access
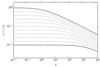
Fig. 2
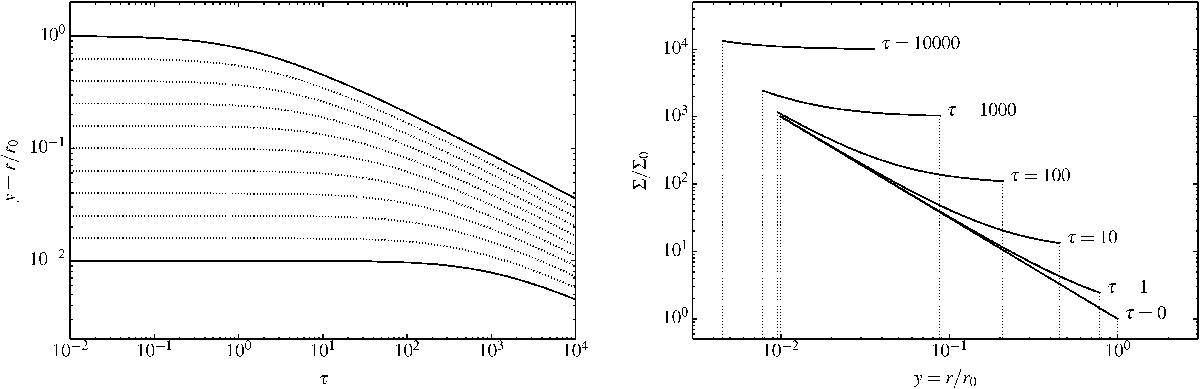
Left panel: solutions to Eq. (16)for a disc with n = 1.5, initially extending from r = 0.01r0 to r = r0. Solid lines show the evolution of the inner and outer disc radius and dotted lines show several intermediate radii. Right panel: corresponding surface density distribution Σ(r,t)/Σ0 from Eq. (17)for several values of τ.
This figure is made of several images, please see below:
Current usage metrics show cumulative count of Article Views (full-text article views including HTML views, PDF and ePub downloads, according to the available data) and Abstracts Views on Vision4Press platform.
Data correspond to usage on the plateform after 2015. The current usage metrics is available 48-96 hours after online publication and is updated daily on week days.
Initial download of the metrics may take a while.