Fig. 7
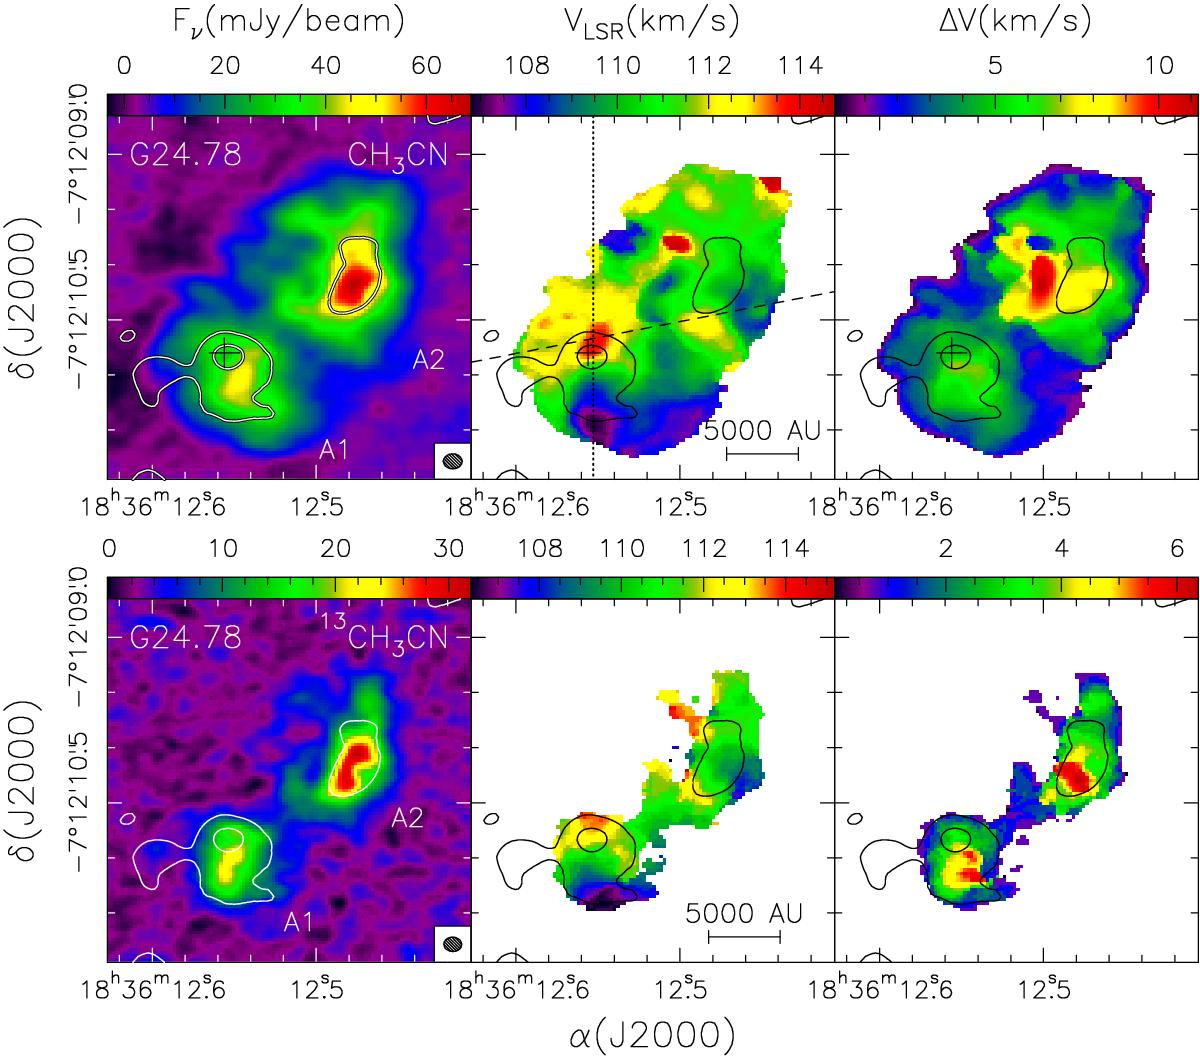
Top: same as Fig. 6, but for G24.78. The cross in the top panels marks the position of the hypercompact Hii region studied by Beltrán et al. (2007) and the dashed line denotes the axis of the bipolar outflow detected by Codella et al. (2013) in the SiO(5–4) line. The dotted line indicates the direction adopted for the corresponding position–velocity plots. Labels A1 and A2 mark the corresponding HMCs, as in Fig. 2. Bottom: same as top panels, but for the 13CH3CN(13–12) K = 2 line.
Current usage metrics show cumulative count of Article Views (full-text article views including HTML views, PDF and ePub downloads, according to the available data) and Abstracts Views on Vision4Press platform.
Data correspond to usage on the plateform after 2015. The current usage metrics is available 48-96 hours after online publication and is updated daily on week days.
Initial download of the metrics may take a while.