Fig. 5
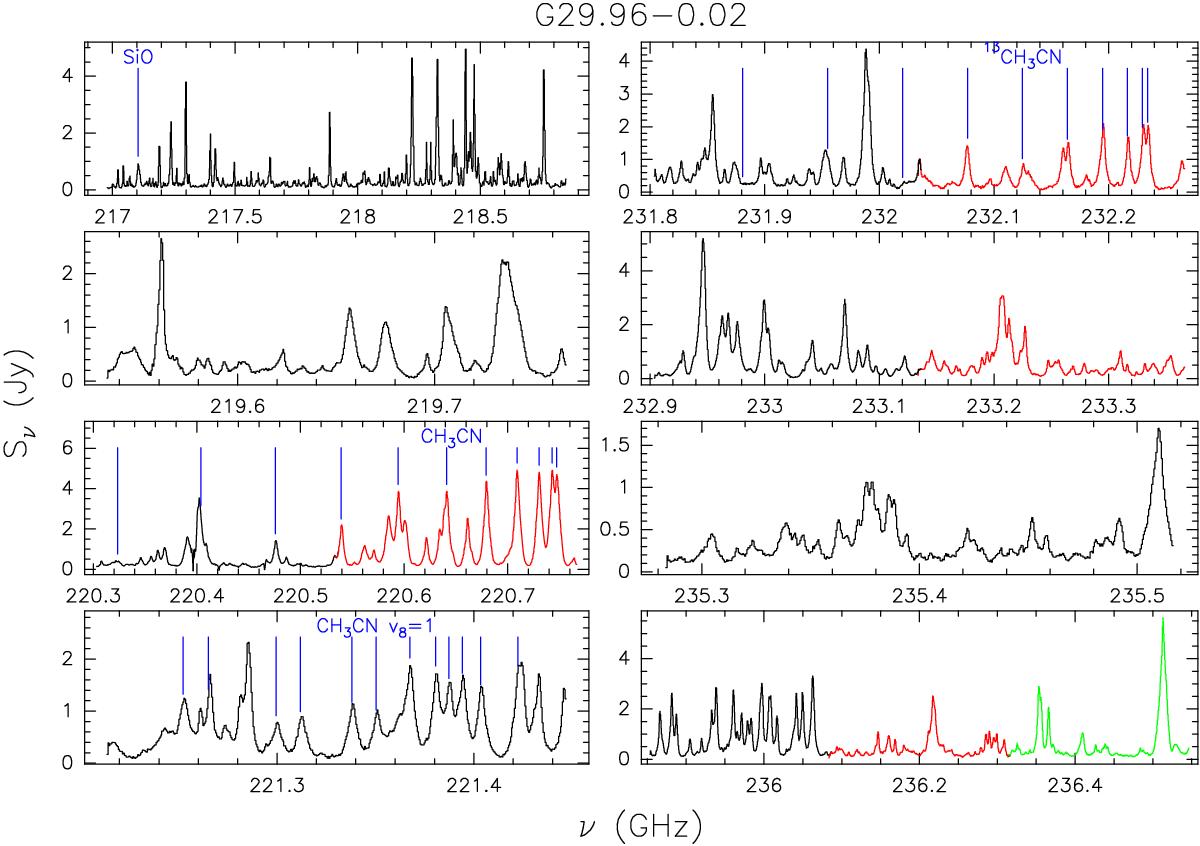
Spectra obtained by integrating the emission over the 5σ contour level of the continuum map of the G29.96 HMC. The whole frequency range covered by our correlator set-up is shown. Different colours in the same box correspond to different spectral windows of the correlator. The vertical lines mark the positions of the SiO(5–4), CH3CN(12–11) ground state, CH3CN(12–11) ν8 = 1, and 13CH3CN(13–12) lines. Not all of these are detected and some of them are heavily blended with other transitions.
Current usage metrics show cumulative count of Article Views (full-text article views including HTML views, PDF and ePub downloads, according to the available data) and Abstracts Views on Vision4Press platform.
Data correspond to usage on the plateform after 2015. The current usage metrics is available 48-96 hours after online publication and is updated daily on week days.
Initial download of the metrics may take a while.