Fig. 21
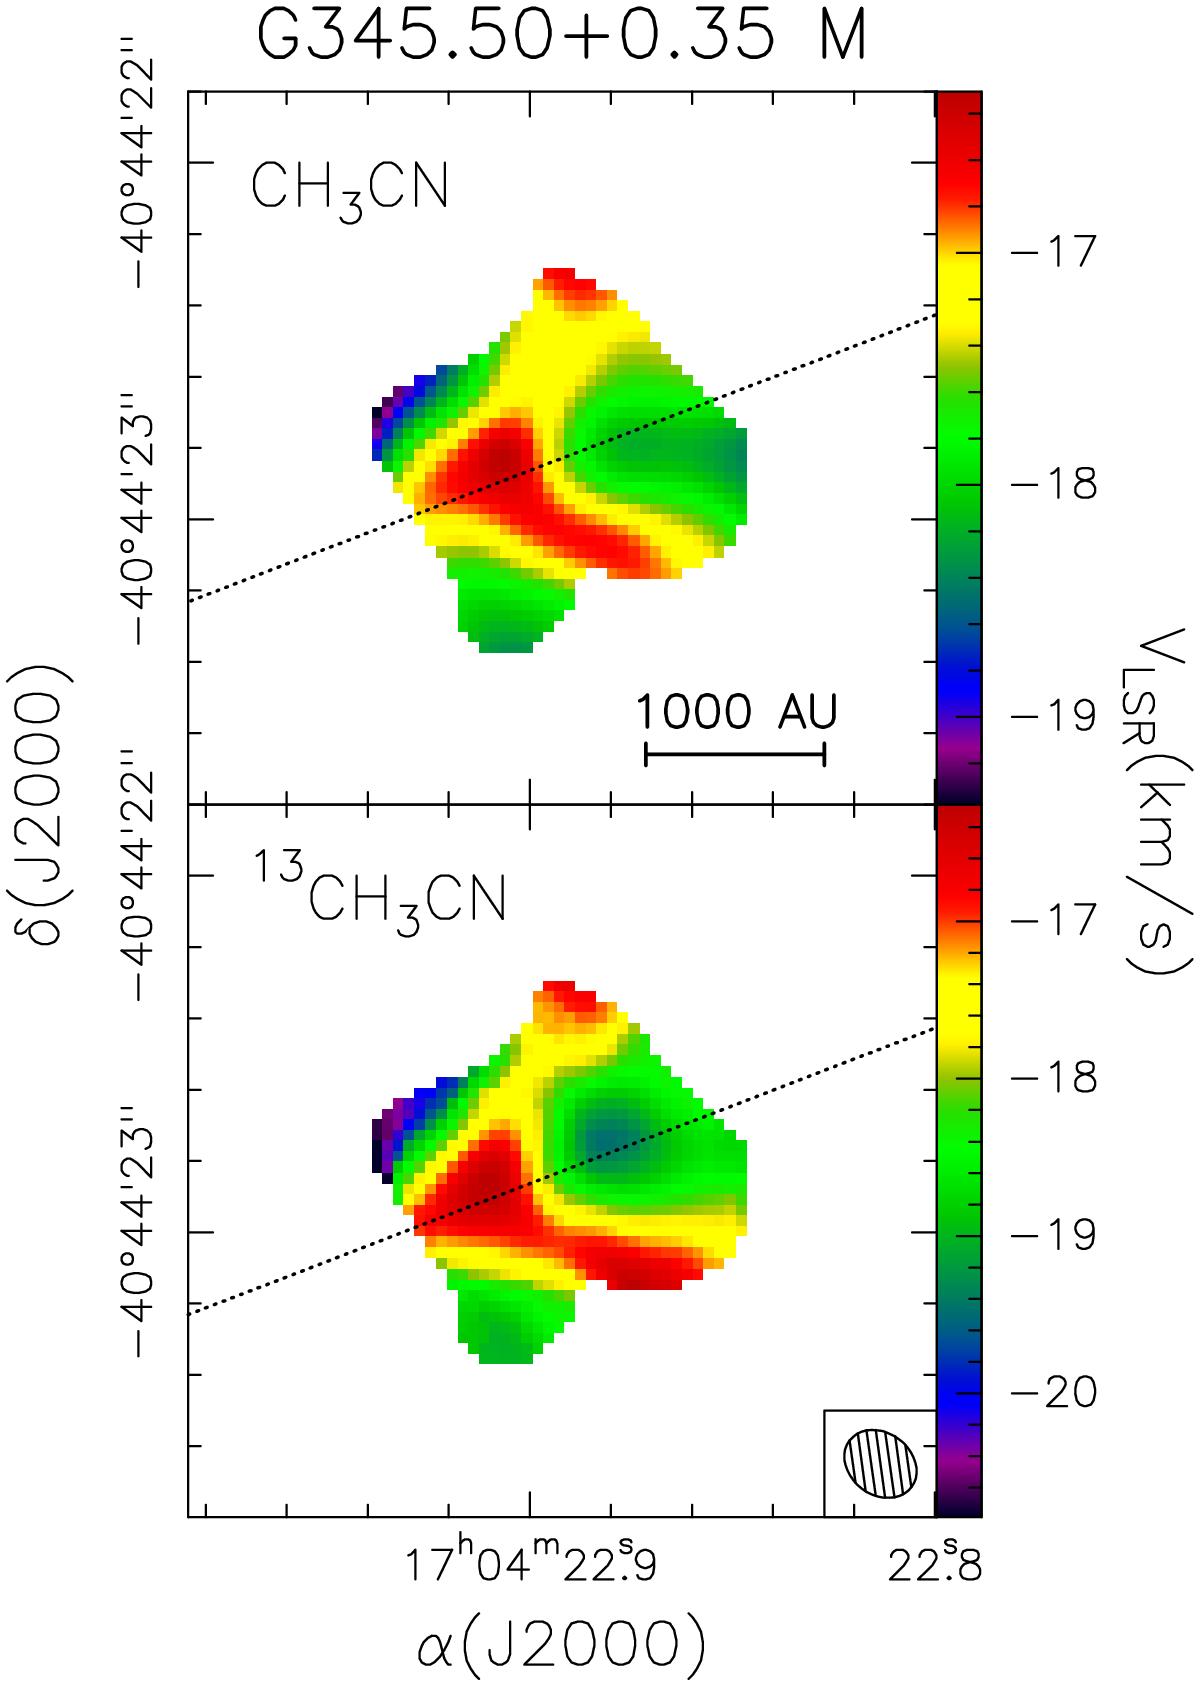
First moment map of the CH3CN(12–11) K = 2 (top panel) and 13CH3CN(13–12) K = 2 (bottom) lines towards the HMC in G345.50 M. The data have been clipped outside the 5σ contour level of the continuum emission to show the velocity gradient along the direction denoted by the dotted line. The synthesized beam is shown in the bottom right corner.
Current usage metrics show cumulative count of Article Views (full-text article views including HTML views, PDF and ePub downloads, according to the available data) and Abstracts Views on Vision4Press platform.
Data correspond to usage on the plateform after 2015. The current usage metrics is available 48-96 hours after online publication and is updated daily on week days.
Initial download of the metrics may take a while.