Fig. 20
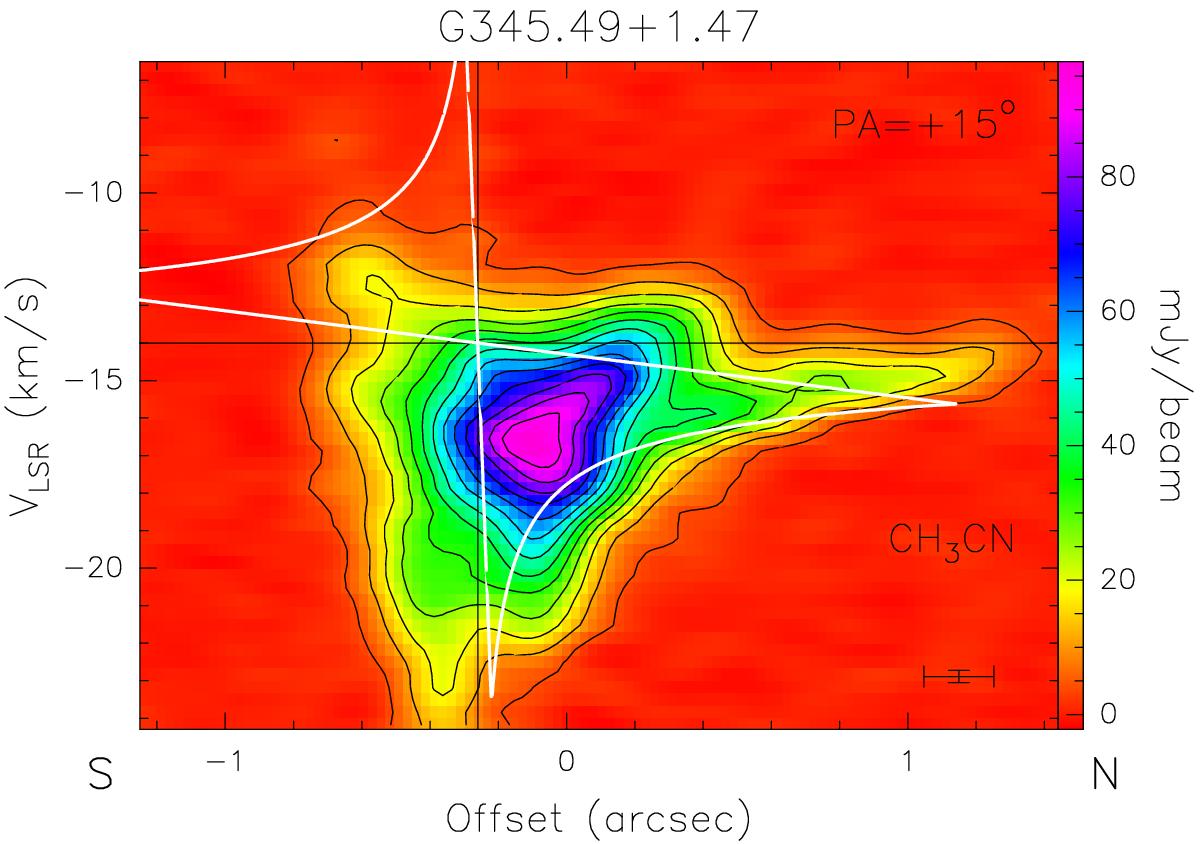
PV plot of the CH3CN(12–11) K = 2 line emission (colour scale and contours) for G345.49 M. The cut is made through the strongest continuum peak, along PA = 15°. Unlike the PV plots of the other sources, here we do not plot the 13CH3CN(13–12) emission since it is barely detected (see Fig. 10). The white pattern corresponds to Keplerian rotation about a 10 M⊙ star.
Current usage metrics show cumulative count of Article Views (full-text article views including HTML views, PDF and ePub downloads, according to the available data) and Abstracts Views on Vision4Press platform.
Data correspond to usage on the plateform after 2015. The current usage metrics is available 48-96 hours after online publication and is updated daily on week days.
Initial download of the metrics may take a while.