Fig. 2
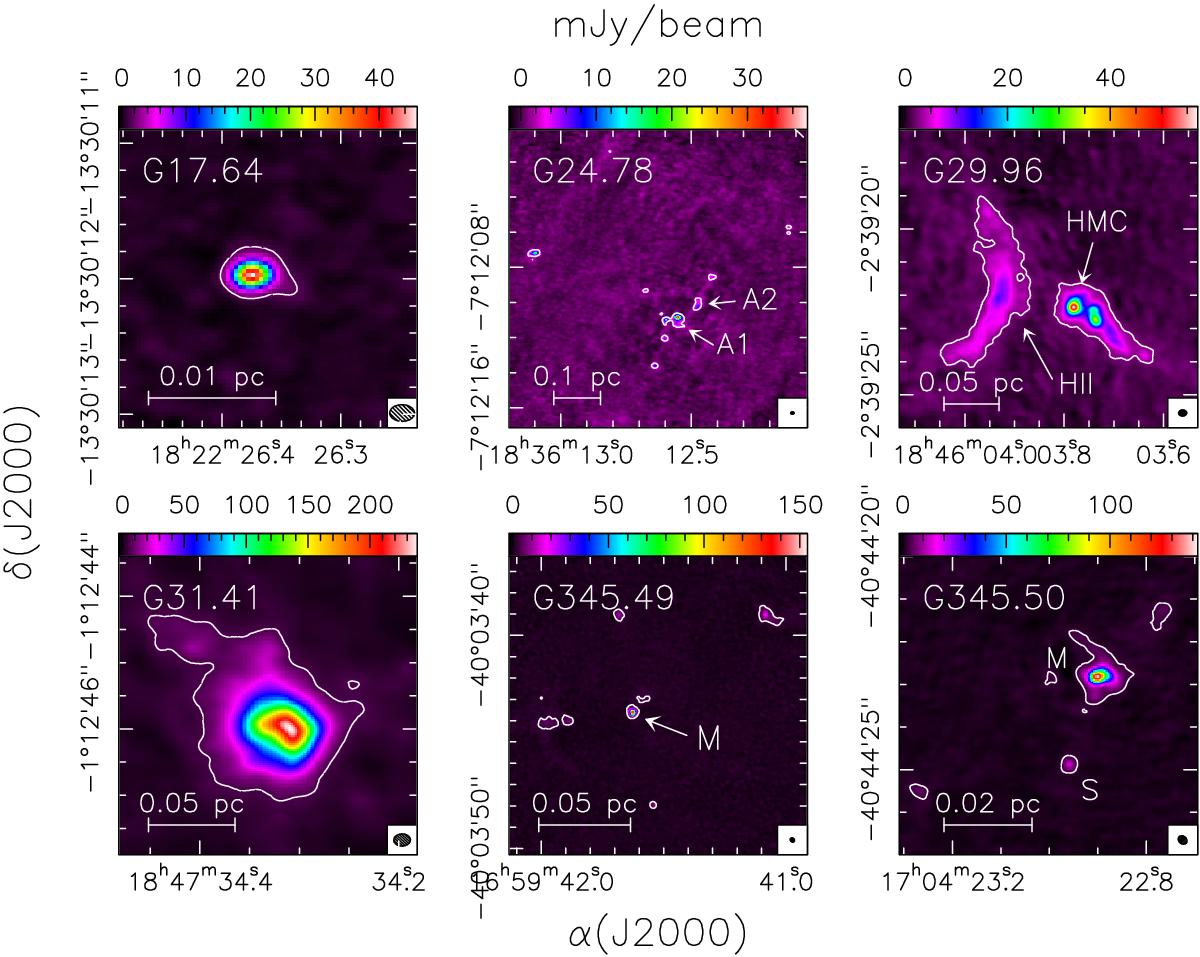
Maps of the continuum emission at 218 GHz from the six targets observed. The solid contours correspond to the 5σ levels. The ellipse in the bottom right corner of each panel denotes the half-power width of the synthesized beam. The maps cover the whole region where emission is detected. The labels indicate the UC Hii region in G29.96 and the cores that we will refer to in the present study. The maximum recoverable scale in these images is ~4′′, much greater than the diameter of the largest cores detected.
Current usage metrics show cumulative count of Article Views (full-text article views including HTML views, PDF and ePub downloads, according to the available data) and Abstracts Views on Vision4Press platform.
Data correspond to usage on the plateform after 2015. The current usage metrics is available 48-96 hours after online publication and is updated daily on week days.
Initial download of the metrics may take a while.