Fig. 19
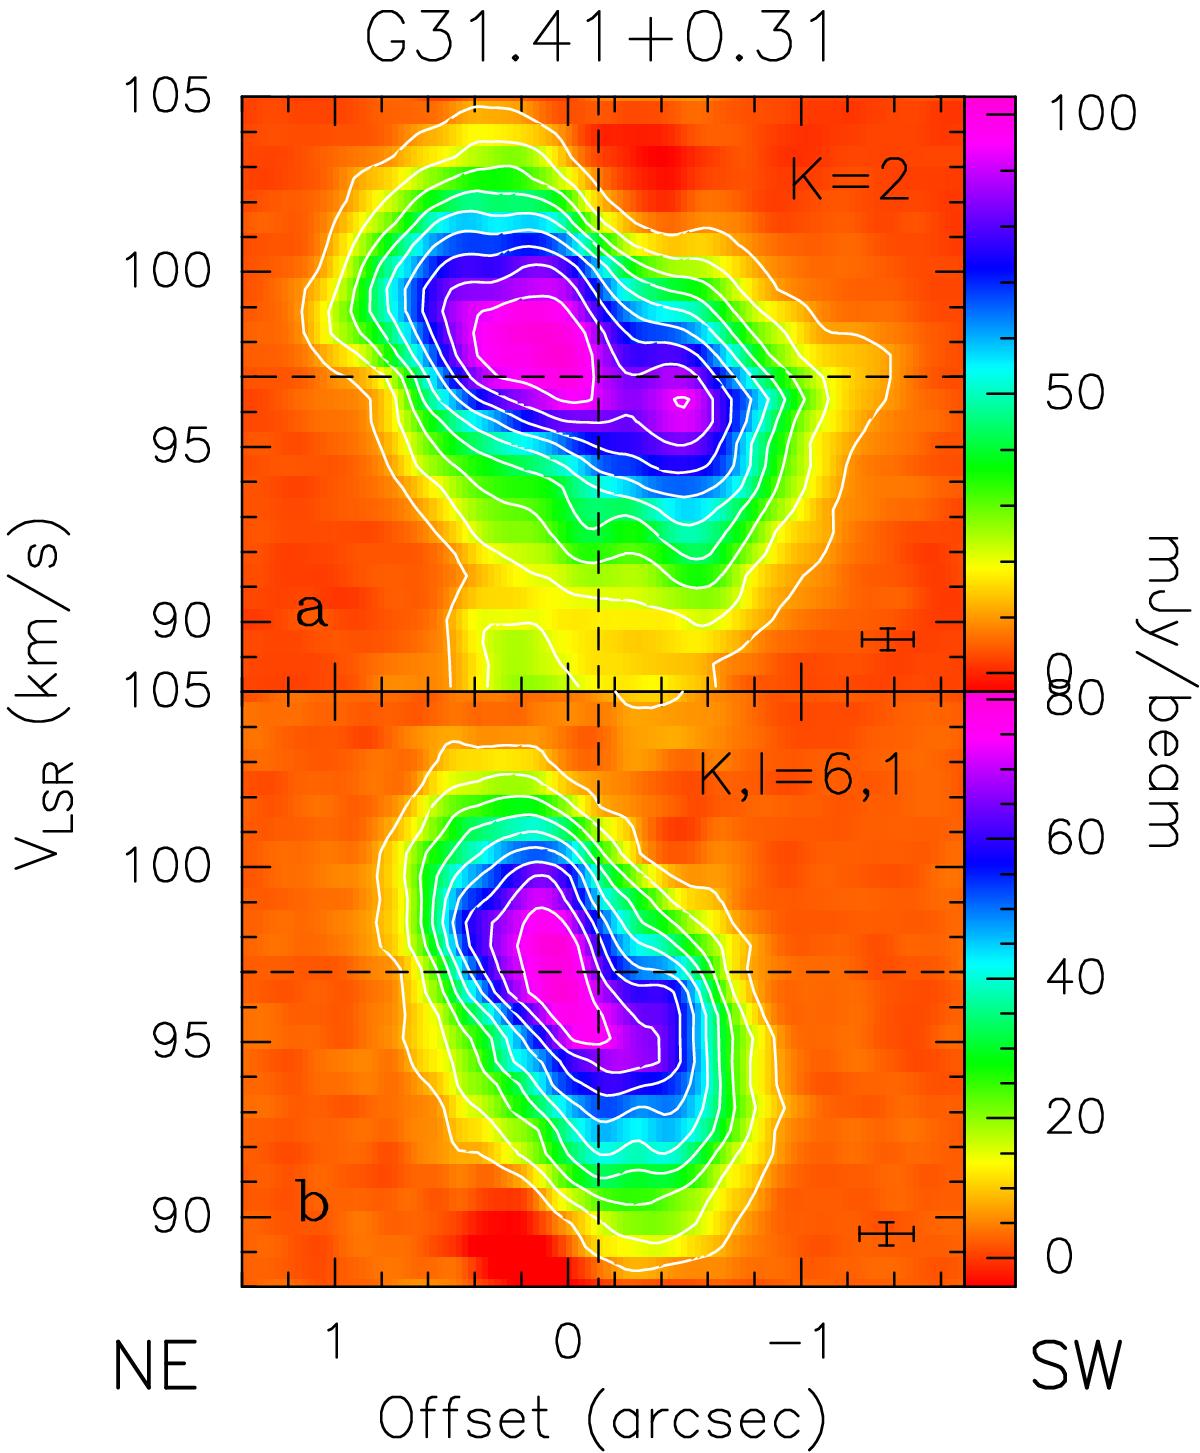
a) PV plot of the 13CH3CN(13–12) K = 2 line emission (excitation energy of 96 K) in G31.41 along a direction with PA = 68° passing through the HMC (dotted line in Fig. 9). The vertical and horizontal dashed lines indicate, respectively, the position of the continuum peak and the systemic velocity. The cross in the bottom right corner denotes the angular and spectral resolutions. b) Same as top panel, but for the CH3CN(12–11) ν8 = 1K,l = 6, 1 line (excitation energy of 778 K).
Current usage metrics show cumulative count of Article Views (full-text article views including HTML views, PDF and ePub downloads, according to the available data) and Abstracts Views on Vision4Press platform.
Data correspond to usage on the plateform after 2015. The current usage metrics is available 48-96 hours after online publication and is updated daily on week days.
Initial download of the metrics may take a while.