Fig. 16
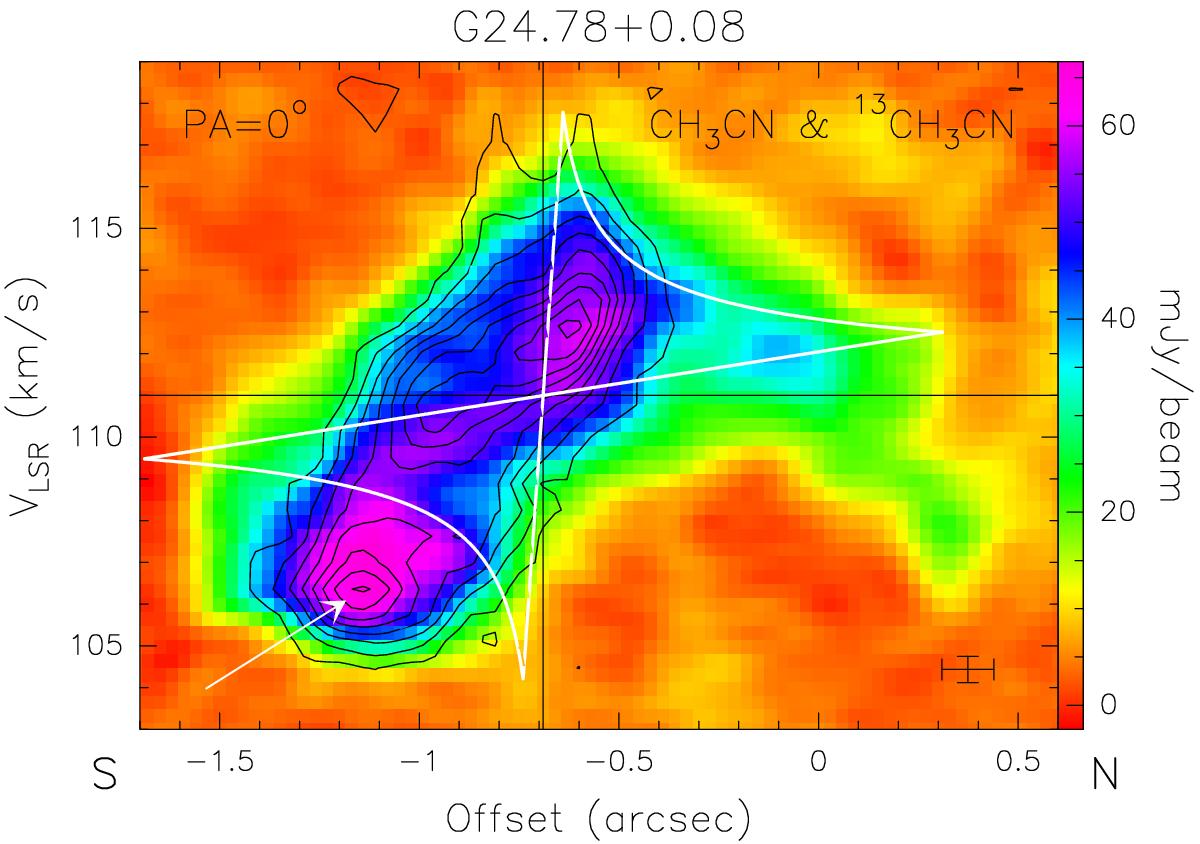
Position–velocity plots of the CH3CN(12–11) K = 2 (colour image) and 13CH3CN(13–12) K = 2 (contours) lines obtained along a N–S cut across the hypercompact Hii region lying inside the HMC G24.78 A1 (see Beltrán et al. 2007). The offset is measured with respect to the phase centre (given in Table 1). The white pattern outlines the region inside which emission is expected if the gas is undergoing Keplerian rotation about a 20 M⊙ star (the mass of the O9.5 star ionizing the hypercompact Hii region; see Beltrán et al. 2007), assuming edge-on inclination. The horizontal and vertical lines mark, respectively, the position of the Hii region and the systemic LSR velocity. The cross in the bottom right indicates the angular and spectral resolution. The arrow indicates the emission peak probably associated with a secondary subcore.
Current usage metrics show cumulative count of Article Views (full-text article views including HTML views, PDF and ePub downloads, according to the available data) and Abstracts Views on Vision4Press platform.
Data correspond to usage on the plateform after 2015. The current usage metrics is available 48-96 hours after online publication and is updated daily on week days.
Initial download of the metrics may take a while.