Free Access
Fig. 14
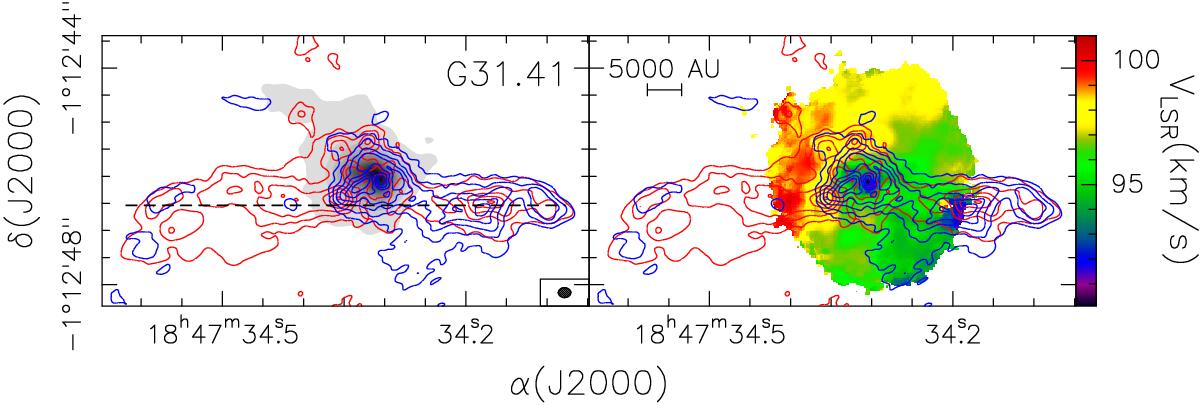
Same as Fig. 13, but for G31.41. The dashed line marks the axis of the SiO bipolar outflow. The SiO emission has been integrated over the velocity intervals 76.1 to 95.0 km s-1 and 100.4 to 119.2 km s-1 for the blue and red wings, respectively. Contour levels range from 7.2 to 37.2 in steps of 6 mJy/beam.
Current usage metrics show cumulative count of Article Views (full-text article views including HTML views, PDF and ePub downloads, according to the available data) and Abstracts Views on Vision4Press platform.
Data correspond to usage on the plateform after 2015. The current usage metrics is available 48-96 hours after online publication and is updated daily on week days.
Initial download of the metrics may take a while.