Fig. 12
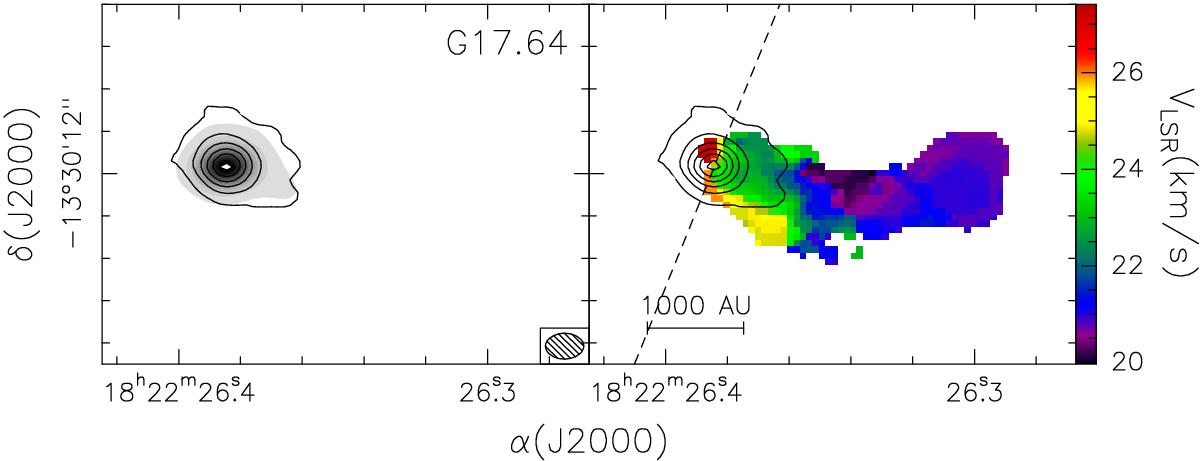
Left: contour map obtained by averaging the emission over the SiO(5–4) line from 4.0 to 39.1 km s-1, overlaid on the map (grey scale) of the 1.4 mm continuum emission in G17.64. Contour levels range from 2.8 to 19.8 in steps of 3.4 mJy/beam. The synthesized beam is shown in the bottom right. Right: same as left panel, overlaid on the first moment map of the CH3CN(12–11) K = 2 line. The dashed line indicates the direction of the axis of the 12CO outflow detected by Kastner et al. (1994).
Current usage metrics show cumulative count of Article Views (full-text article views including HTML views, PDF and ePub downloads, according to the available data) and Abstracts Views on Vision4Press platform.
Data correspond to usage on the plateform after 2015. The current usage metrics is available 48-96 hours after online publication and is updated daily on week days.
Initial download of the metrics may take a while.