Fig. 1
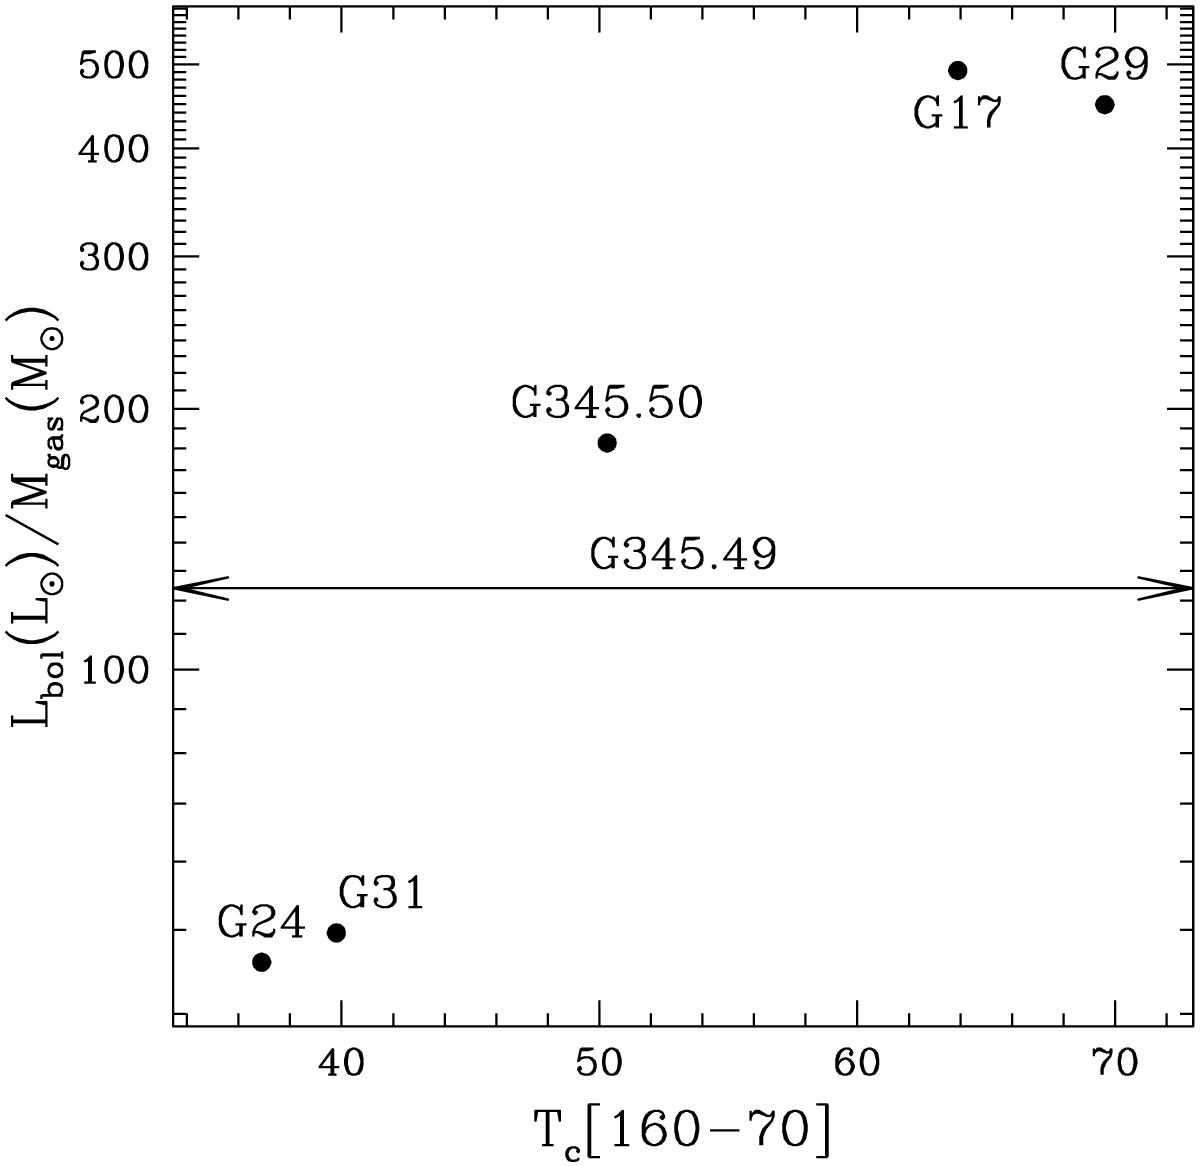
Plot of the ratio between the bolometric luminosity and the mass of the associated molecular clump vs. the colour temperature obtained from the ratio between the far-IR flux densities at 70 and 160 μm, for all the sources of our sample. The horizontal line denotes that for source G345.49 no estimate of Tc [160−70] is possible because the source lies beyond the region covered by the Hi-GAL survey.
Current usage metrics show cumulative count of Article Views (full-text article views including HTML views, PDF and ePub downloads, according to the available data) and Abstracts Views on Vision4Press platform.
Data correspond to usage on the plateform after 2015. The current usage metrics is available 48-96 hours after online publication and is updated daily on week days.
Initial download of the metrics may take a while.