Free Access
Fig. 6
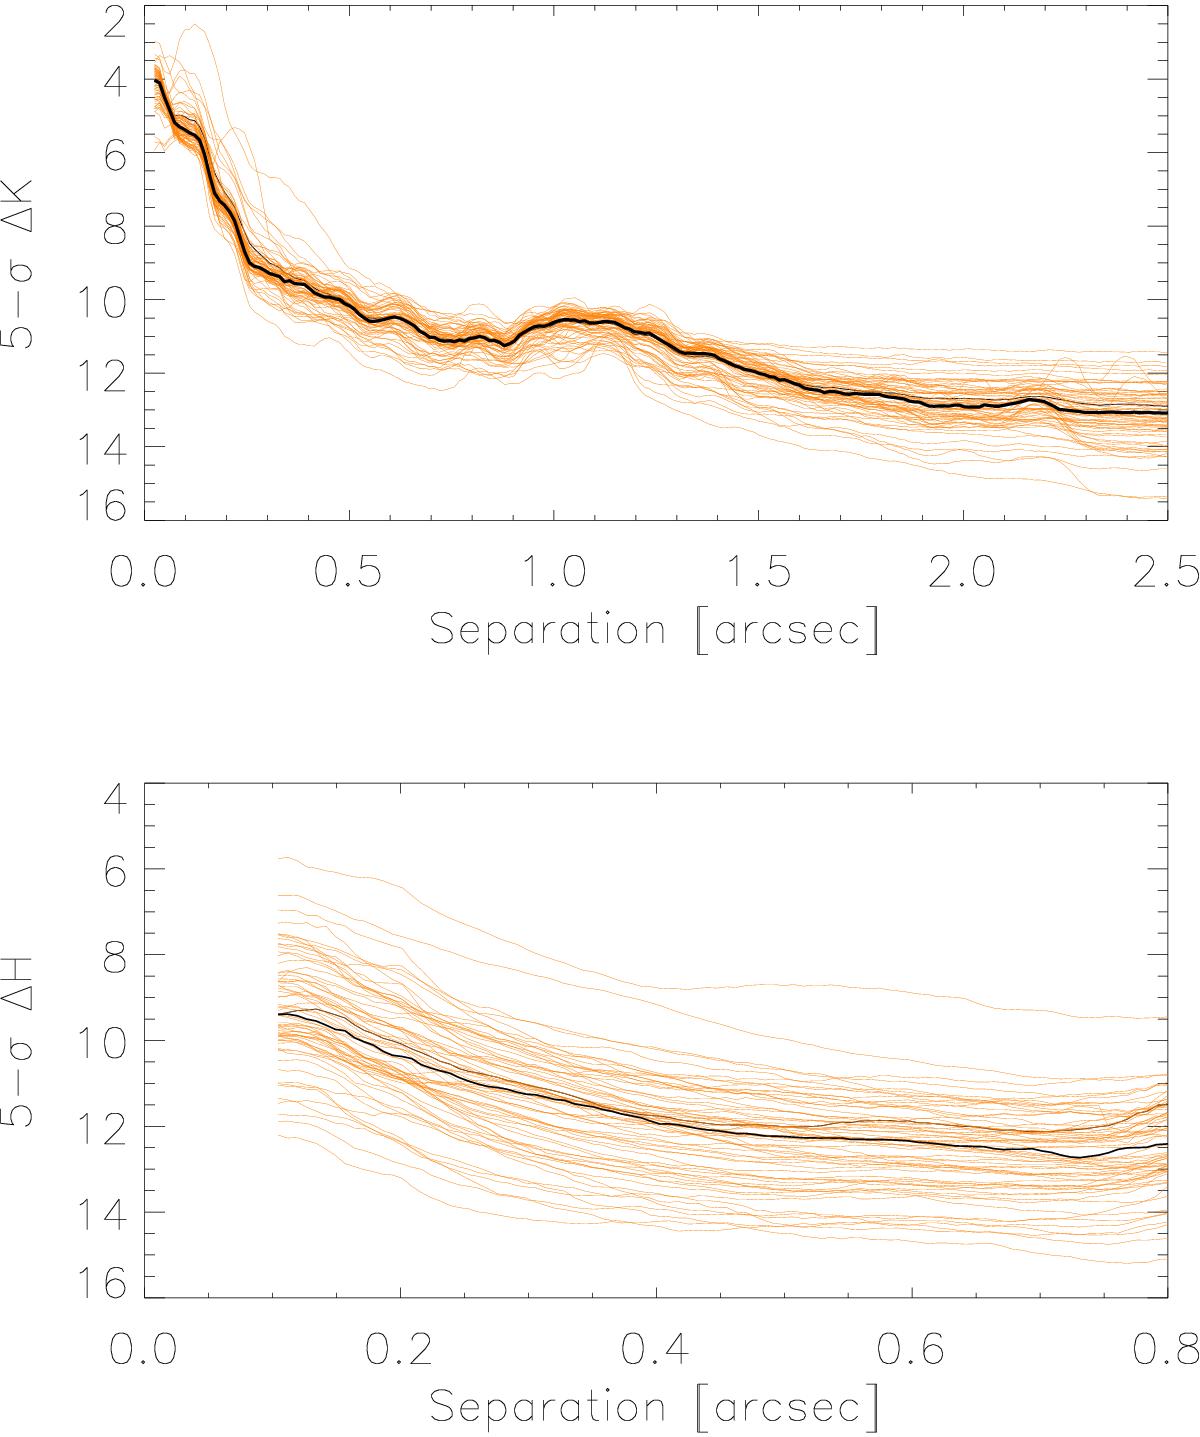
Contrast plots obtained for each single target in the sample (thin lines) with IFS at 1.6 μm (bottom) and IRDIS at 2.15 μm (top). The thick black line represents the median contrast obtained over the whole sample. Note the different sizes of the X axis.
Current usage metrics show cumulative count of Article Views (full-text article views including HTML views, PDF and ePub downloads, according to the available data) and Abstracts Views on Vision4Press platform.
Data correspond to usage on the plateform after 2015. The current usage metrics is available 48-96 hours after online publication and is updated daily on week days.
Initial download of the metrics may take a while.