Fig. 9
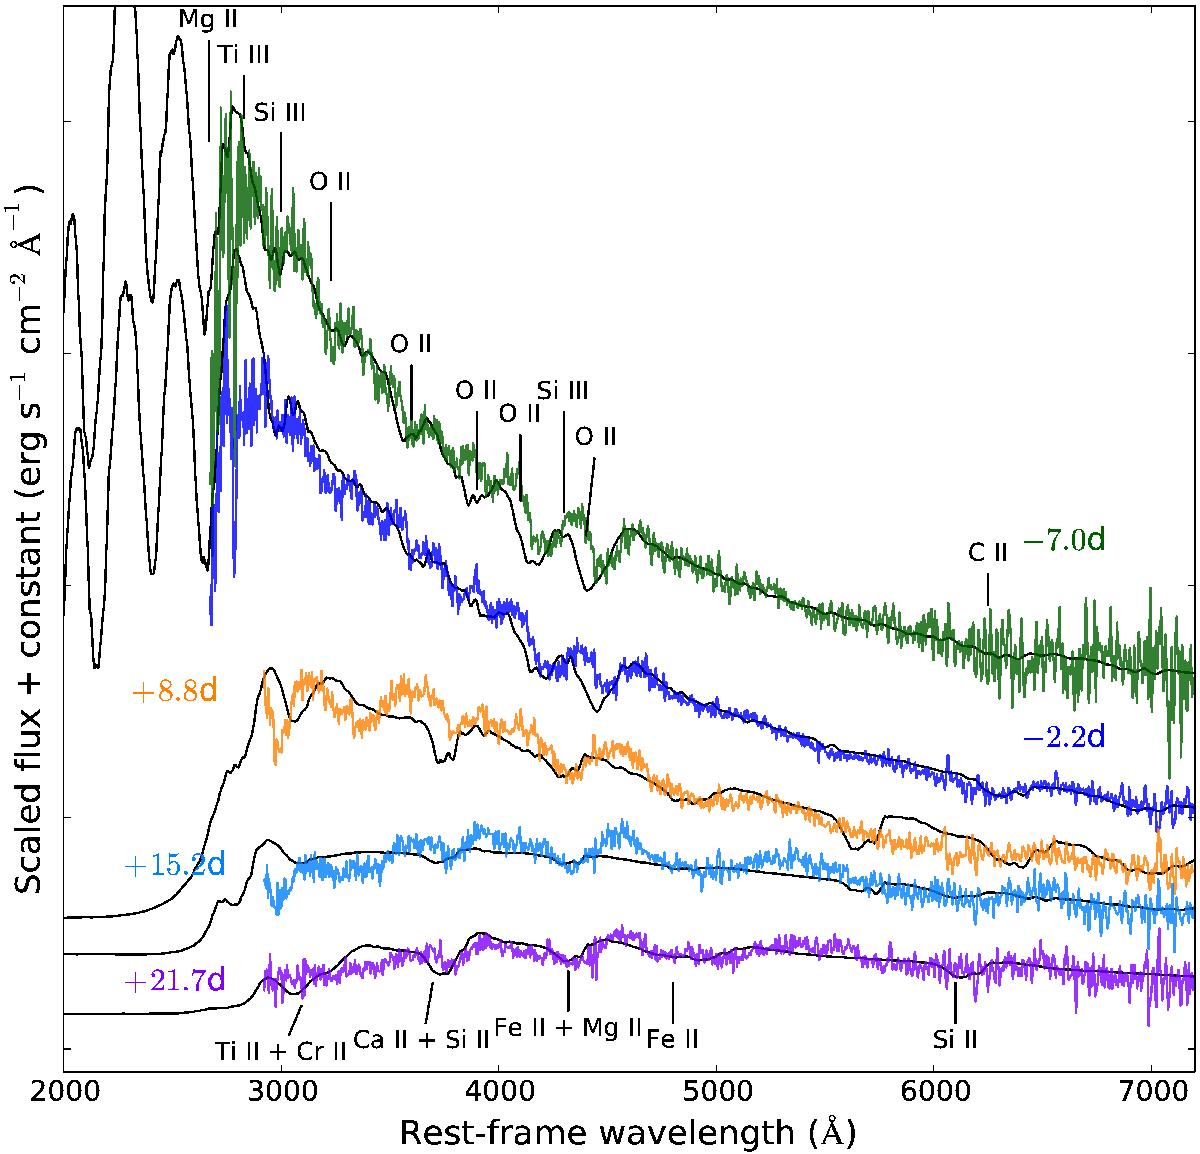
Spectral synthesis model (in black) from Mazzali et al. (2016) applied for LSQ14mo spectra. Each spectrum is labelled with its rest-frame time from the r-band light curve maximum. The −7.0 d spectrum is dominated by O and C, other intermediate-mass elements also shown and labelled. The −2.2 d spectrum is similar to −7.0 d in terms of element identification, temperature, luminosity and velocity. The + 8.8 d spectrum, with a poor model fitting, shows a hot continuum but rather cool lines. This implies an additional luminosity may come from the SN ejecta interacting with a H- and He-poor shell. The + 15.2 d spectrum is similar to + 21.7 d and the strongest features are intermediate elements such asSi ii ,Fe ii ,Mg iiandCa ii . All identified lines are labelled.
Current usage metrics show cumulative count of Article Views (full-text article views including HTML views, PDF and ePub downloads, according to the available data) and Abstracts Views on Vision4Press platform.
Data correspond to usage on the plateform after 2015. The current usage metrics is available 48-96 hours after online publication and is updated daily on week days.
Initial download of the metrics may take a while.