Fig. 3
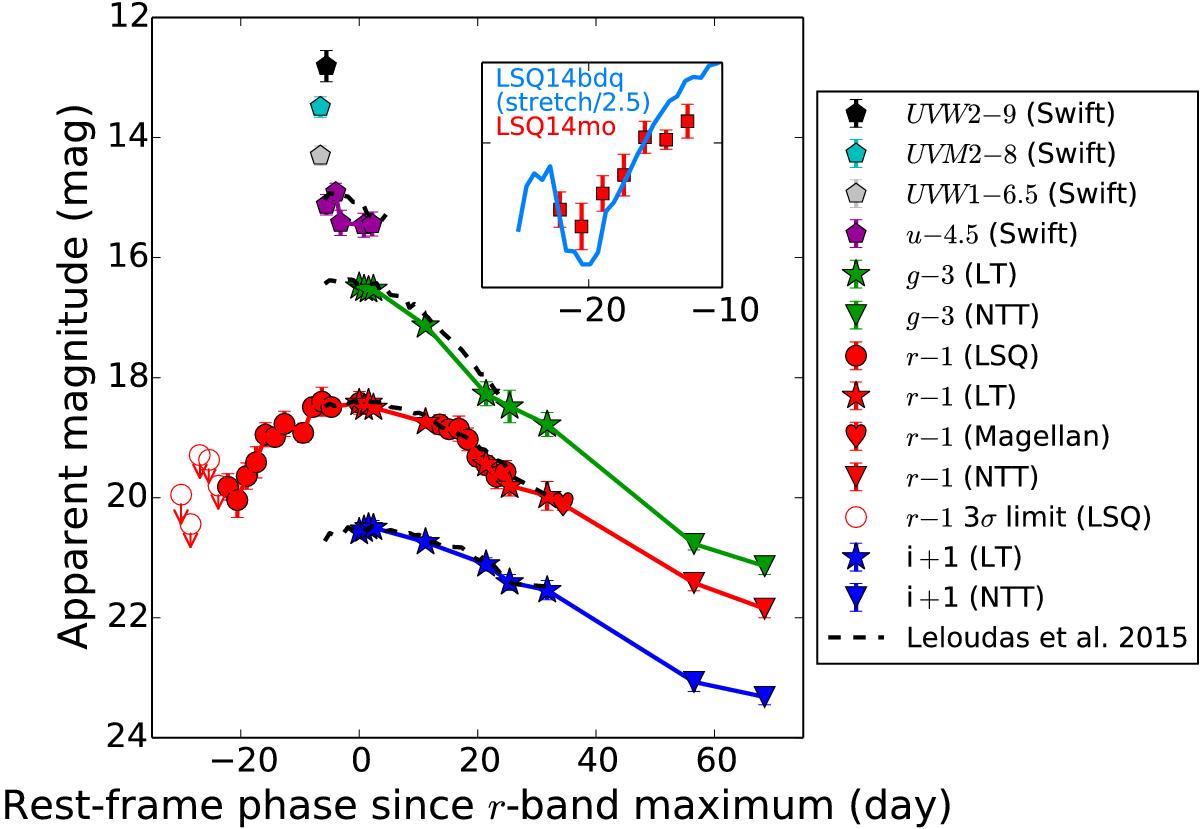
Photometry of LSQ14mo from the UV to the optical. The early- and late-time 3σ detection limits are shown in empty symbols. The phase (day) has been corrected for time dilation (z = 0.256) and relative to the SN r-band maximum on MJD 56 697. The period from 100 to 200 days is skipped due to no observations. The inset panel shows the absolute g-band pre-maximum light curves of LSQ14mo and LSQ14bdq with a stretch in time divided by 2.5, an early bump of LSQ14mo is plausibly detected. For comparison, the optical photometry given by Leloudas et al. (2015a), which is plotted as dashed lines, is in a good agreement with our measurements.
Current usage metrics show cumulative count of Article Views (full-text article views including HTML views, PDF and ePub downloads, according to the available data) and Abstracts Views on Vision4Press platform.
Data correspond to usage on the plateform after 2015. The current usage metrics is available 48-96 hours after online publication and is updated daily on week days.
Initial download of the metrics may take a while.