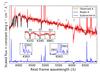
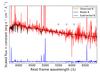
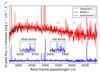
Fig. 2

VLT + FORS2 spectra of the host galaxy system extracted at the three spatially resolved positions (A, B, and C; shown in red) and fit with the stellar population models from starlight (black lines overlapping observed spectra; see Sect. B). The blue spectra are subtracted residuals for the models. For position A, the upper inset panels show strong stellar absorption features of Balmer lines, while the bottom inset panels show detections of a weak auroral λ4363 line and clear detections of [ N ii ] lines around Hα . For position C, the inset panels zoom in to WR feature regions, and no broad feature was detected. The atmospheric telluric absorption features are marked with the Earth symbol.
Current usage metrics show cumulative count of Article Views (full-text article views including HTML views, PDF and ePub downloads, according to the available data) and Abstracts Views on Vision4Press platform.
Data correspond to usage on the plateform after 2015. The current usage metrics is available 48-96 hours after online publication and is updated daily on week days.
Initial download of the metrics may take a while.