Fig. 14
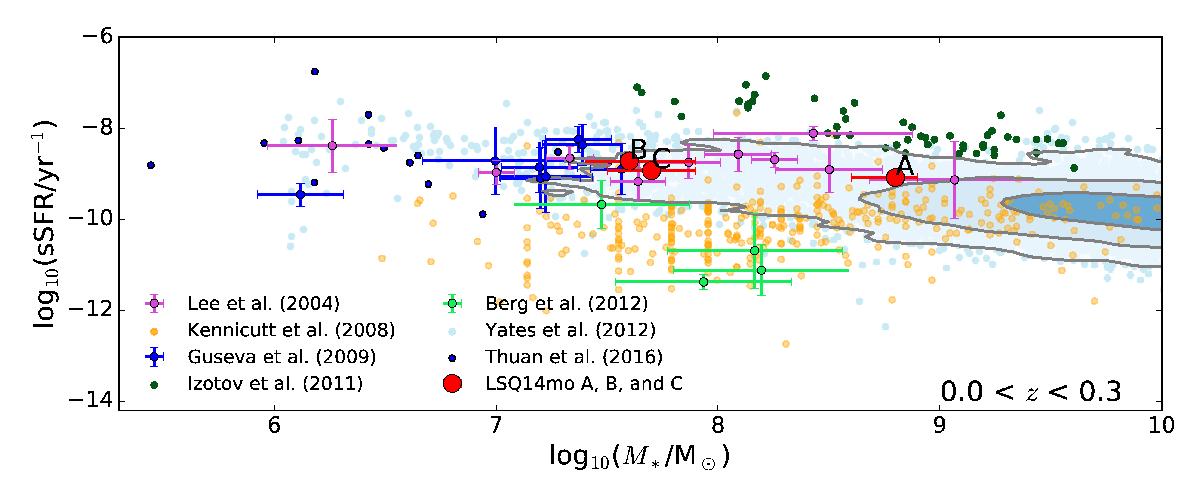
Relation between stellar mass (M∗) and specific SFR (sSFR) for positions A, B, and C (red points) from LSQ14mo system compared to a selection of local dwarf galaxies (z < 0.3). The contours represent the star-forming sample of Yates et al. (2012), showing the 68th, 95th, and 99.5th percentiles of the distribution. All three LSQ14mo systems have SFRs (and sSFRs) slightly higher than most galaxies of their mass.
Current usage metrics show cumulative count of Article Views (full-text article views including HTML views, PDF and ePub downloads, according to the available data) and Abstracts Views on Vision4Press platform.
Data correspond to usage on the plateform after 2015. The current usage metrics is available 48-96 hours after online publication and is updated daily on week days.
Initial download of the metrics may take a while.