Free Access
Fig. 13
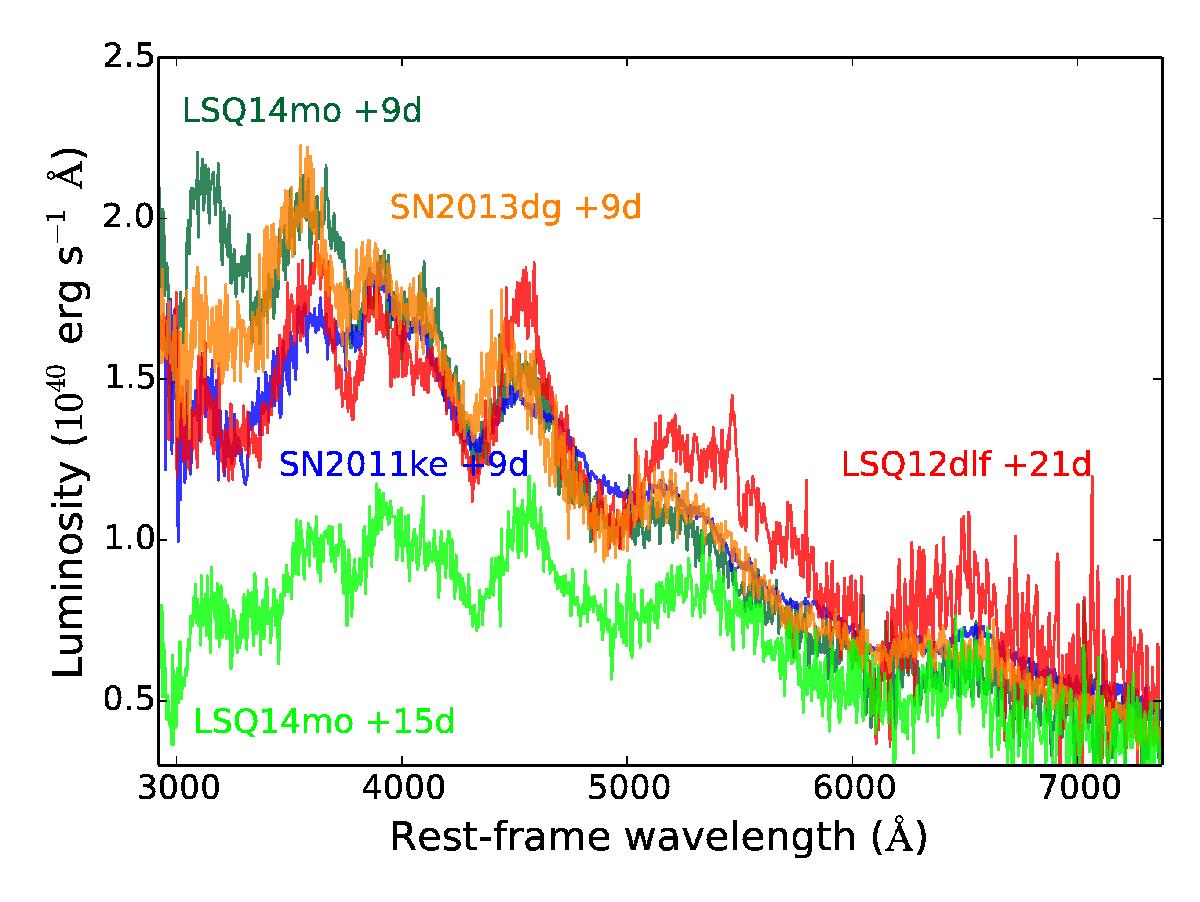
Spectral comparison between LSQ14mo and other fast-declining SLSNe at a similar observational phase. The interacting feature of a blue continuum but rather cool lines is also shown in SN 2013dg at +9d, SN 2011ke at +9d, and LSQ12dlf at +21d. Data for comparison are taken from Inserra et al. (2013), Nicholl et al. (2014).
Current usage metrics show cumulative count of Article Views (full-text article views including HTML views, PDF and ePub downloads, according to the available data) and Abstracts Views on Vision4Press platform.
Data correspond to usage on the plateform after 2015. The current usage metrics is available 48-96 hours after online publication and is updated daily on week days.
Initial download of the metrics may take a while.