Fig. 1
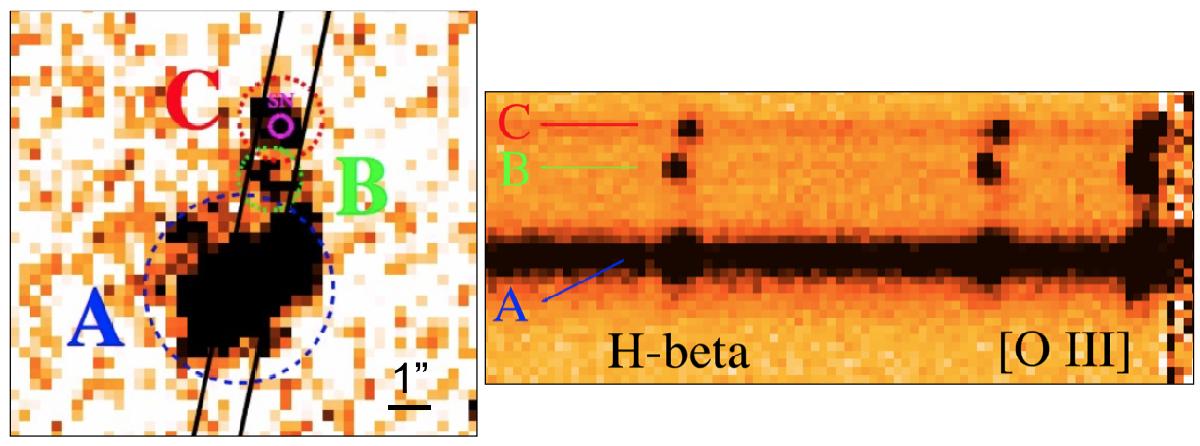
Left: VLT + FORS2 slit angle overlaid on NTT + EFOSC2 (PESSTO) i-band image of the host galaxy system taken on 2015 February 12 (+293.1 d). We have labelled the LSQ14mo position (C), brightH ii region (B) and PSO J155.6730-16.9216 (A). North is up and east is left. Right: portion of the 2D spectrum from VLT + FORS2 showing the emission lines Hβ and [ O iii ] λλ4959,5007. Three spatially resolved components, A, B, and C, also offset in velocity, are clearly seen.
Current usage metrics show cumulative count of Article Views (full-text article views including HTML views, PDF and ePub downloads, according to the available data) and Abstracts Views on Vision4Press platform.
Data correspond to usage on the plateform after 2015. The current usage metrics is available 48-96 hours after online publication and is updated daily on week days.
Initial download of the metrics may take a while.