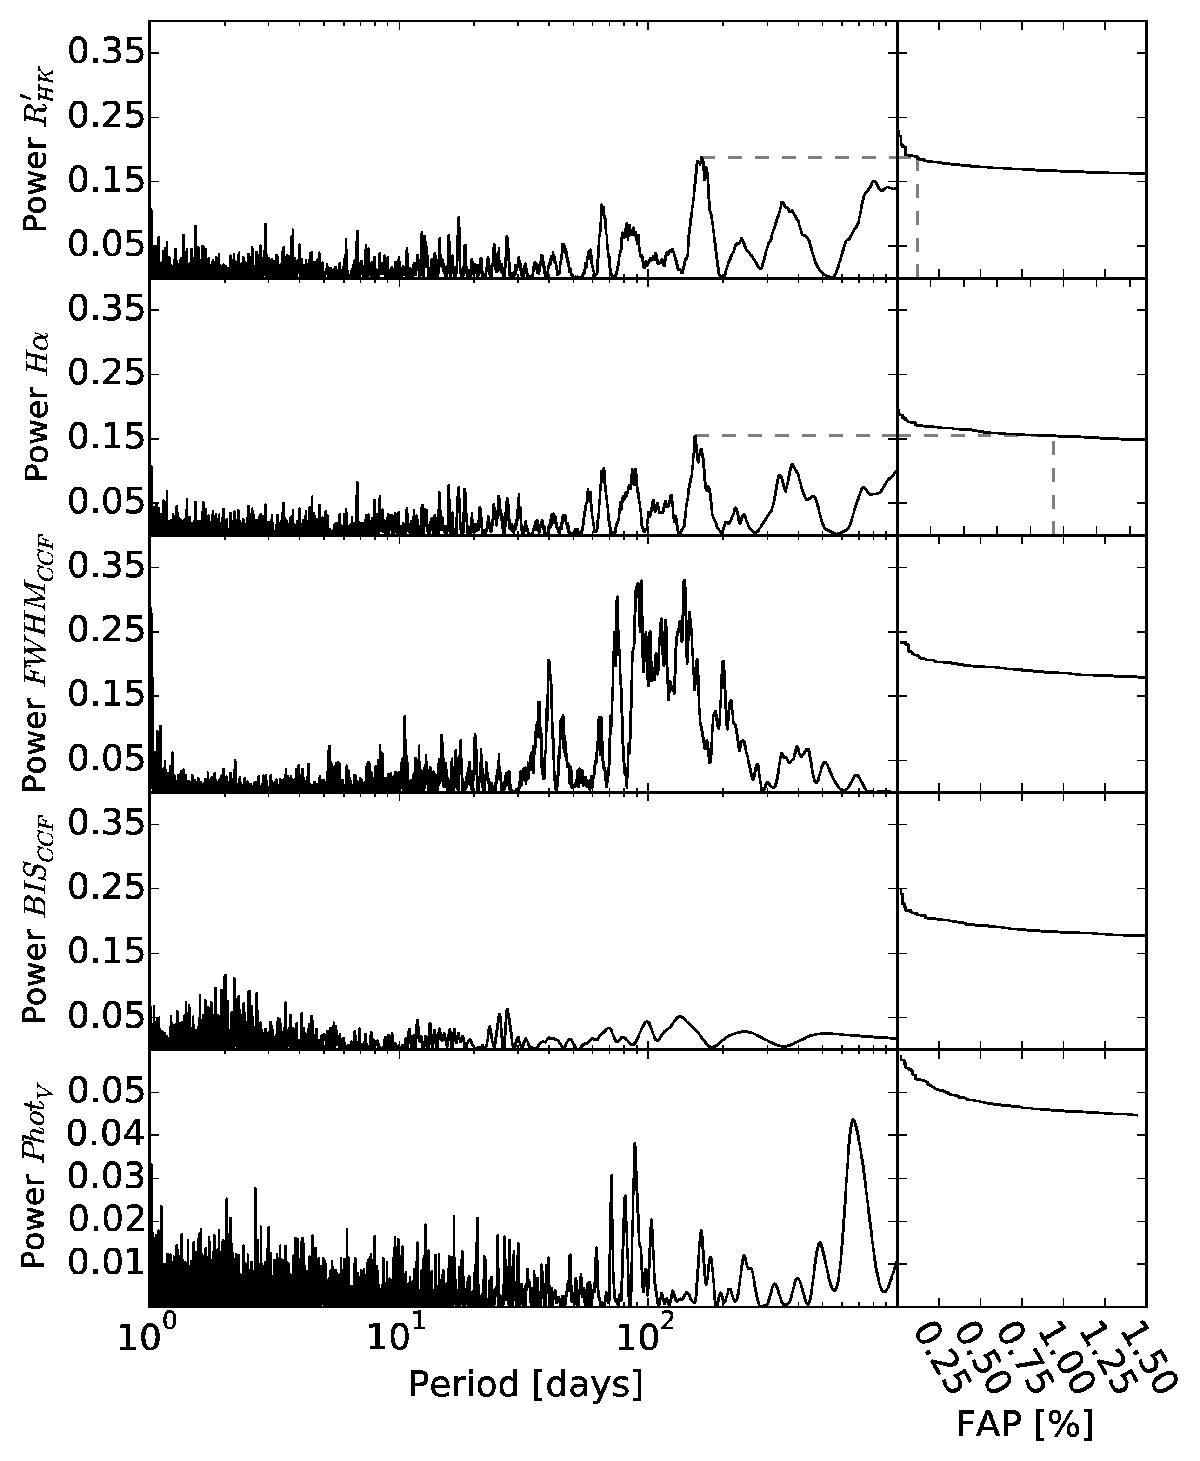
Fig. 7

Periodograms of the ![]() , Hα, FWHMCCF, and the BISCCF activity indices of GJ 3323. Significant peaks (FAP < 1%) are located at ~160 days for
, Hα, FWHMCCF, and the BISCCF activity indices of GJ 3323. Significant peaks (FAP < 1%) are located at ~160 days for ![]() and Hα. The FWHMCCF periodogram is less clean at that periodicity and additionally shows power excess at ~40 days. No favored periodicity is present in the periodogram of BISCCF, while the photometry periodogram shows power excess at about 665 and 88 days with 2% and 10.2% FAPs, respectively.
and Hα. The FWHMCCF periodogram is less clean at that periodicity and additionally shows power excess at ~40 days. No favored periodicity is present in the periodogram of BISCCF, while the photometry periodogram shows power excess at about 665 and 88 days with 2% and 10.2% FAPs, respectively.
Current usage metrics show cumulative count of Article Views (full-text article views including HTML views, PDF and ePub downloads, according to the available data) and Abstracts Views on Vision4Press platform.
Data correspond to usage on the plateform after 2015. The current usage metrics is available 48-96 hours after online publication and is updated daily on week days.
Initial download of the metrics may take a while.


