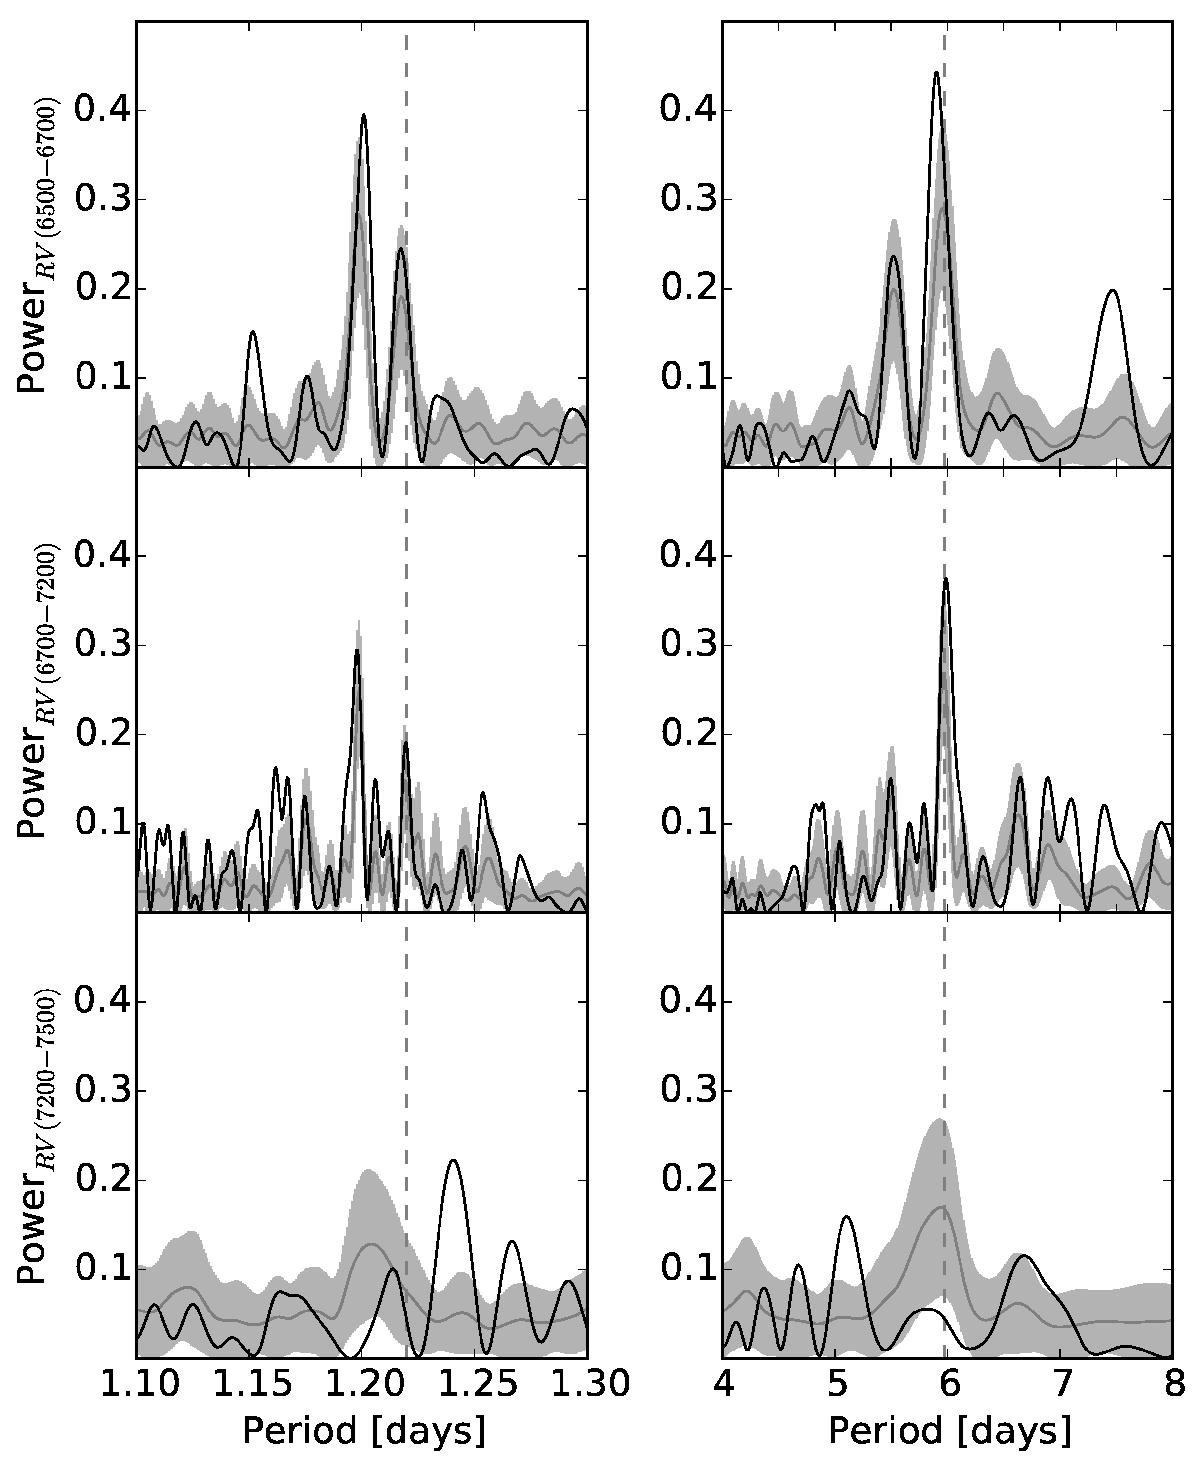
Fig. 4

Periodograms of the tree subsets of RVs. The left and right columns are zooms around the 1.2 and 6 days zones of interest, respectively. The black curves depict the periodograms for the observed RVs (raw), the gray curves show the average periodograms of the 100 synthetic RVs, while the light gray areas represent the 1σ zones. The top and middle rows of the left column show separately the 1-day alias of the 6.0 day peak (located at 1.20 days) and the 1.22-day signal (vertical dashed line). The bottom row in the right column shows that the lack of power for the subsample with BJD-2 450 000 between 7200 and 7500 is consistent (very close to the 1σ level) with the constrained coverage in phase of the 6.0-day signal.
Current usage metrics show cumulative count of Article Views (full-text article views including HTML views, PDF and ePub downloads, according to the available data) and Abstracts Views on Vision4Press platform.
Data correspond to usage on the plateform after 2015. The current usage metrics is available 48-96 hours after online publication and is updated daily on week days.
Initial download of the metrics may take a while.


