Fig. 3

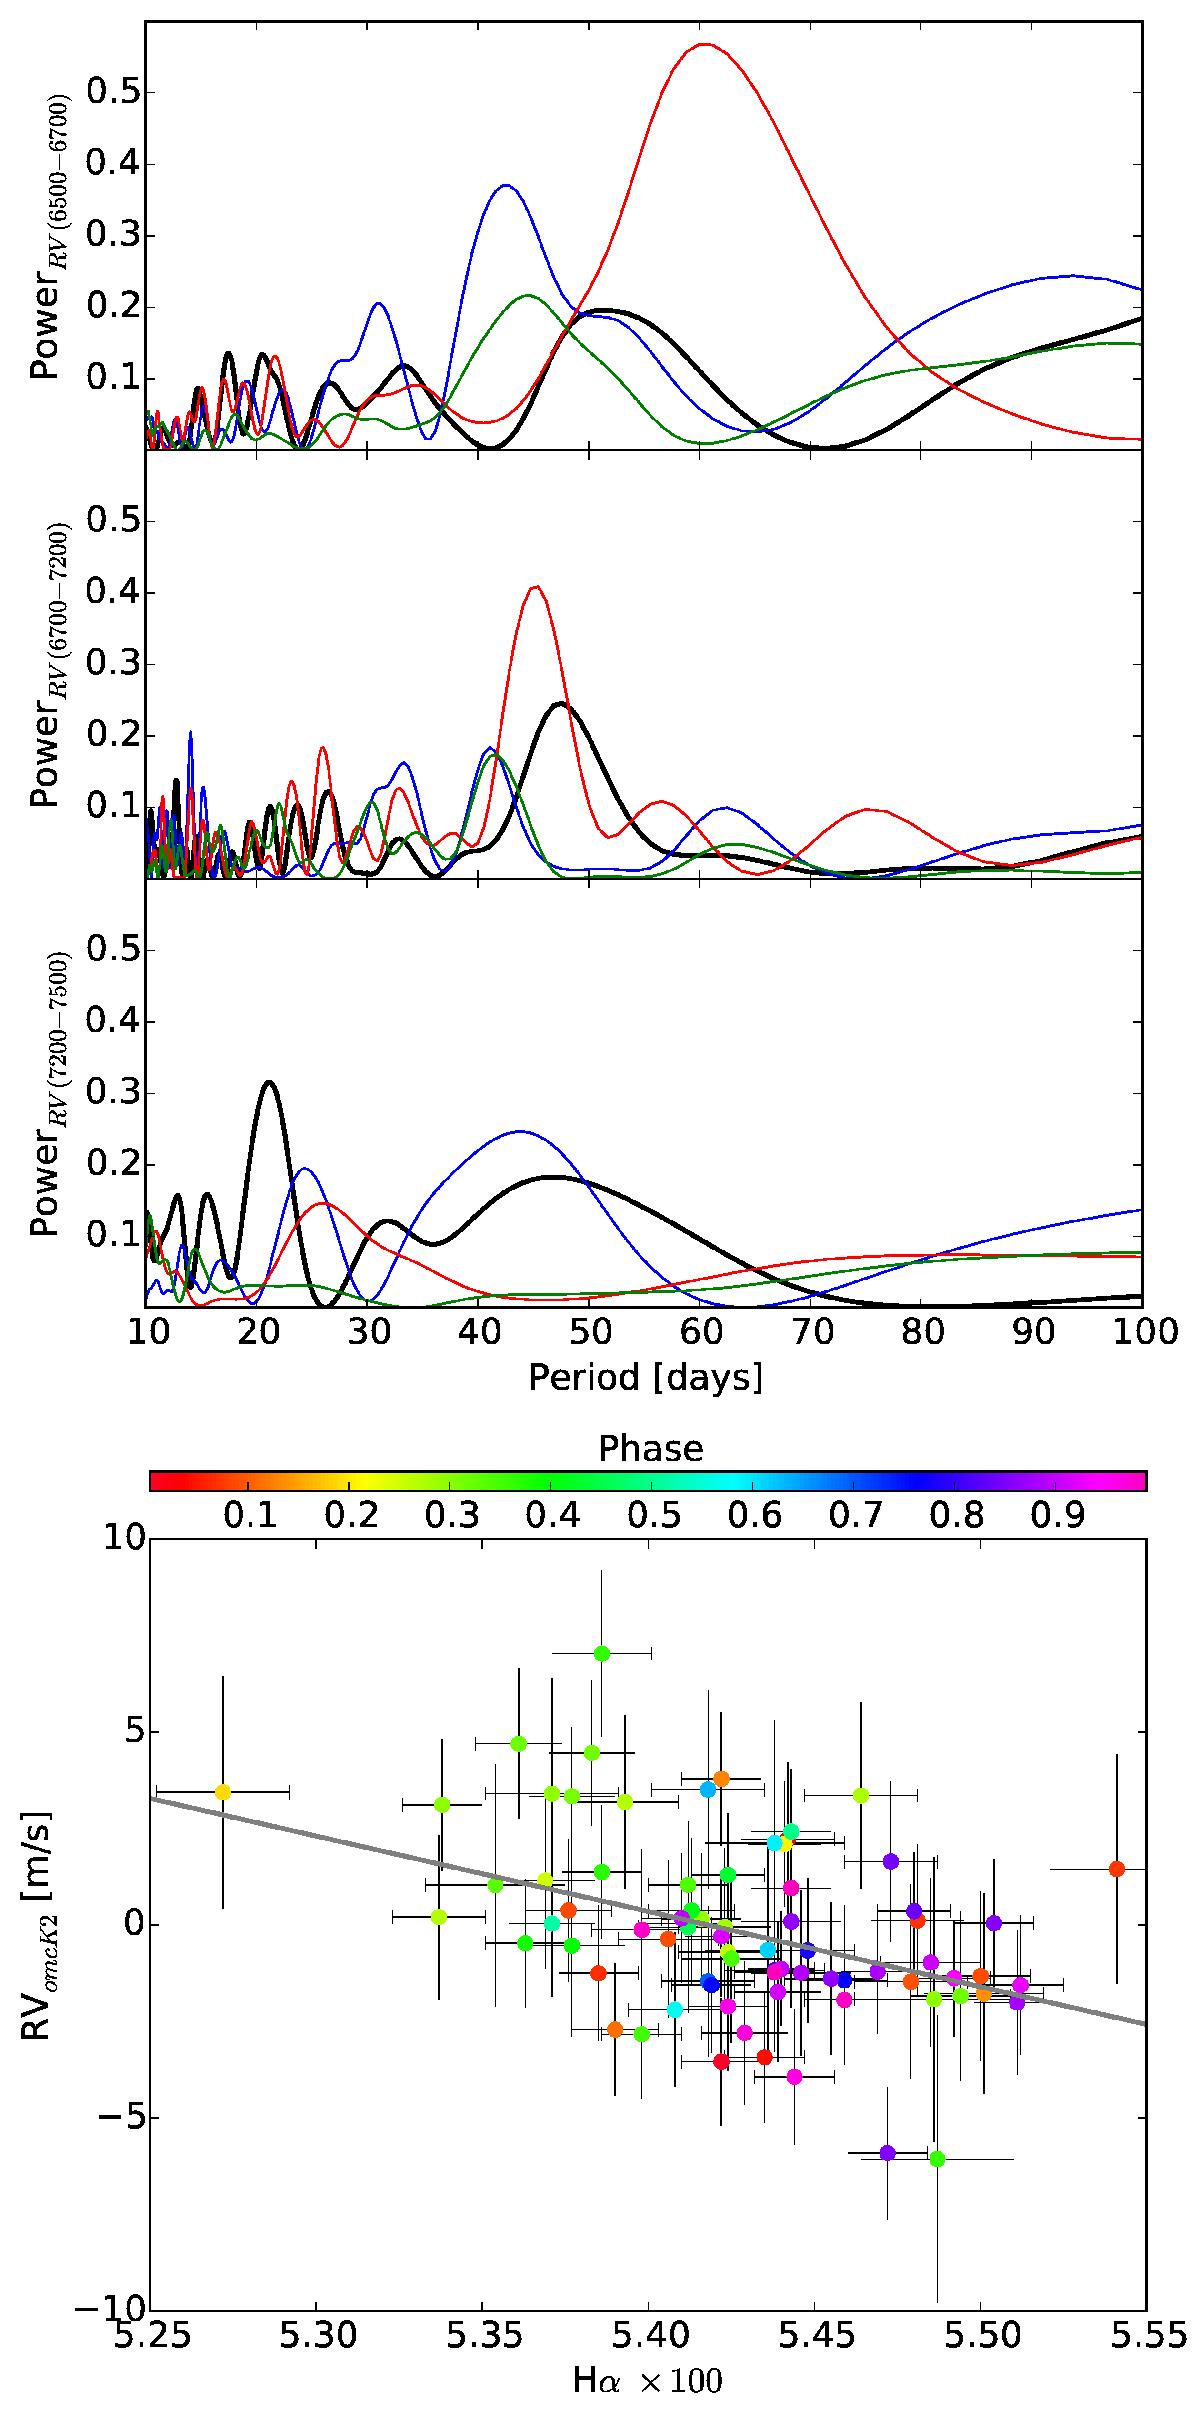
Top panel: black, red, blue and green curves depict the periodogram of the GJ 3138 RVs after removing the 1.22 and 6.0 days periodicities, Hα, ![]() , and FWHMCCF, respectively. The first row shows periodograms for BJD-2 450 000 between 6500 and 6700, second row for 6700–7200, and third row for 7200–7500. The second row shows that RVs and Hα have a power excess at the same periodicity. RVs–Hα anti-correlation is subtracted (see text). Bottom panel: 77 radial velocities as a function of the Hα for BJD from 2 456 700 to 2 457 200. The phase for a periodicity of 48.2 days is color-coded. The linear fit is used to correct the RV interval.
, and FWHMCCF, respectively. The first row shows periodograms for BJD-2 450 000 between 6500 and 6700, second row for 6700–7200, and third row for 7200–7500. The second row shows that RVs and Hα have a power excess at the same periodicity. RVs–Hα anti-correlation is subtracted (see text). Bottom panel: 77 radial velocities as a function of the Hα for BJD from 2 456 700 to 2 457 200. The phase for a periodicity of 48.2 days is color-coded. The linear fit is used to correct the RV interval.
Current usage metrics show cumulative count of Article Views (full-text article views including HTML views, PDF and ePub downloads, according to the available data) and Abstracts Views on Vision4Press platform.
Data correspond to usage on the plateform after 2015. The current usage metrics is available 48-96 hours after online publication and is updated daily on week days.
Initial download of the metrics may take a while.


