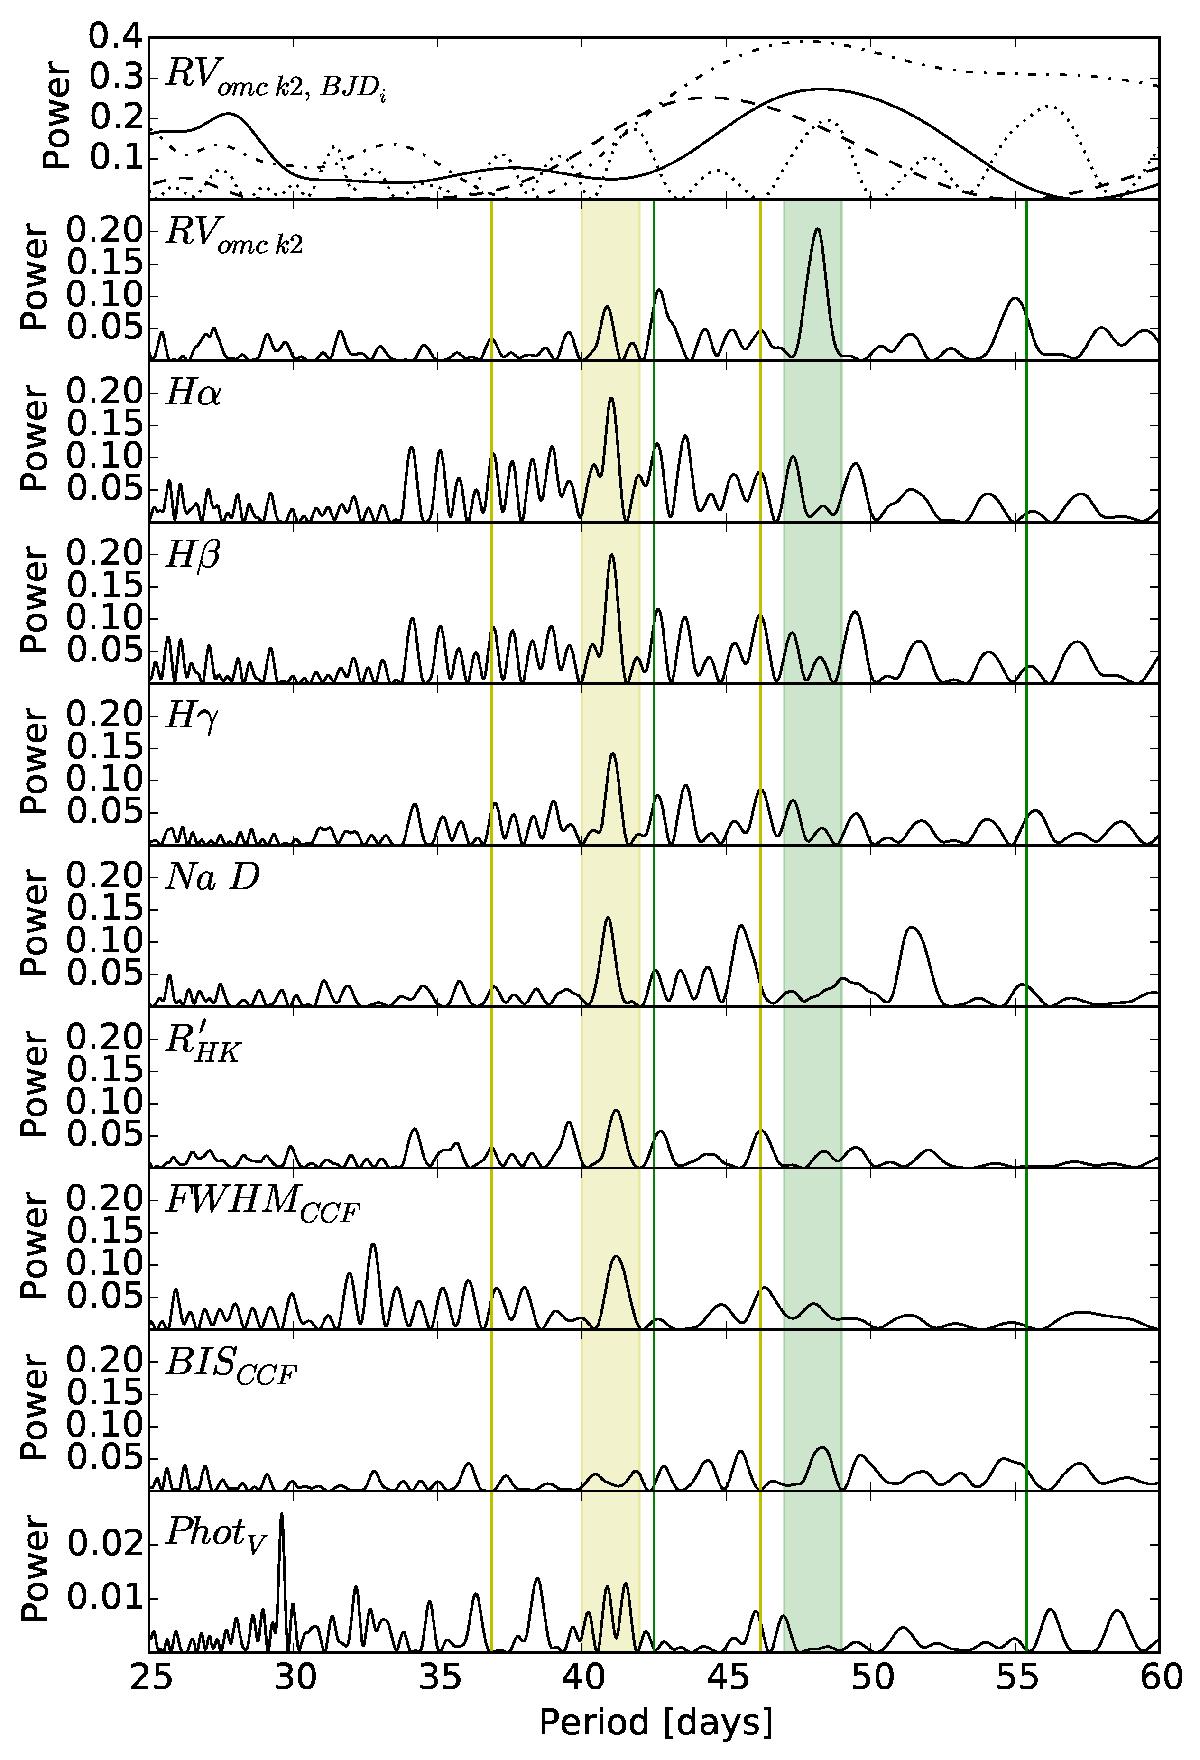
Fig. 21

From top to bottom: first row shows the periodogram of RVomc k2 for different RV subsets where BJD is within 4790–5750 (dotted), 5750–6100 (solid), 6100–6350 (dash-dotted), and 6900–7150 (dashed). There is power excess at about 48 days for all the subsets. The second row shows the RVomc k2 periodogram for the entire sample. The third to ninth rows show the periodograms of different stellar activity indicators. The green and yellow shaded areas represent the planetary and stellar signals, respectively. The same color-code is used for the thin vertical lines depicting the yearly aliases. The periodicities of the two signals are clearly separated.
Current usage metrics show cumulative count of Article Views (full-text article views including HTML views, PDF and ePub downloads, according to the available data) and Abstracts Views on Vision4Press platform.
Data correspond to usage on the plateform after 2015. The current usage metrics is available 48-96 hours after online publication and is updated daily on week days.
Initial download of the metrics may take a while.


