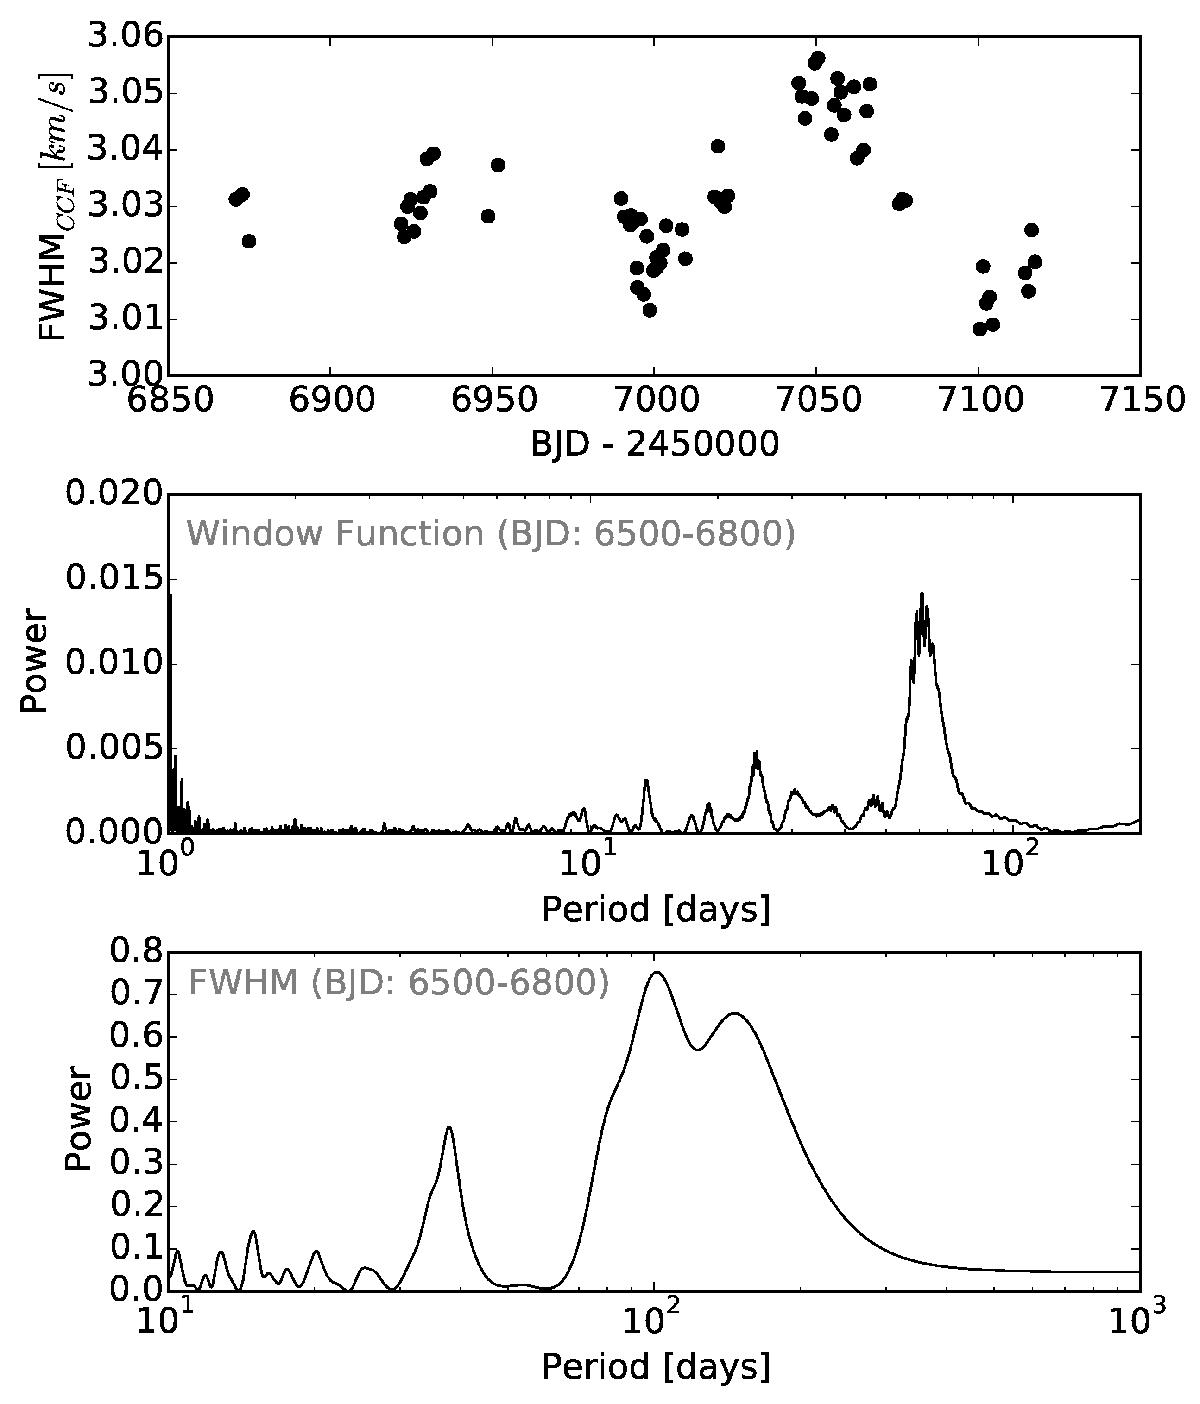
Fig. 10

When focusing on data with BJD between 6800 and 7200, we note that the FWHMCCF increases at about BJD 7050, while at BJD 7000 and 7100 it is closer to the average value (upper panel) and produces the peak at ~100 days in its periodogram. The window function – with power excess at ~60 days (middle panel) – for this subsample shows that our sampling clearly explains that the 40-day peak is an alias of the stronger 100-day peak (bottom panel).
Current usage metrics show cumulative count of Article Views (full-text article views including HTML views, PDF and ePub downloads, according to the available data) and Abstracts Views on Vision4Press platform.
Data correspond to usage on the plateform after 2015. The current usage metrics is available 48-96 hours after online publication and is updated daily on week days.
Initial download of the metrics may take a while.


