Fig. 9
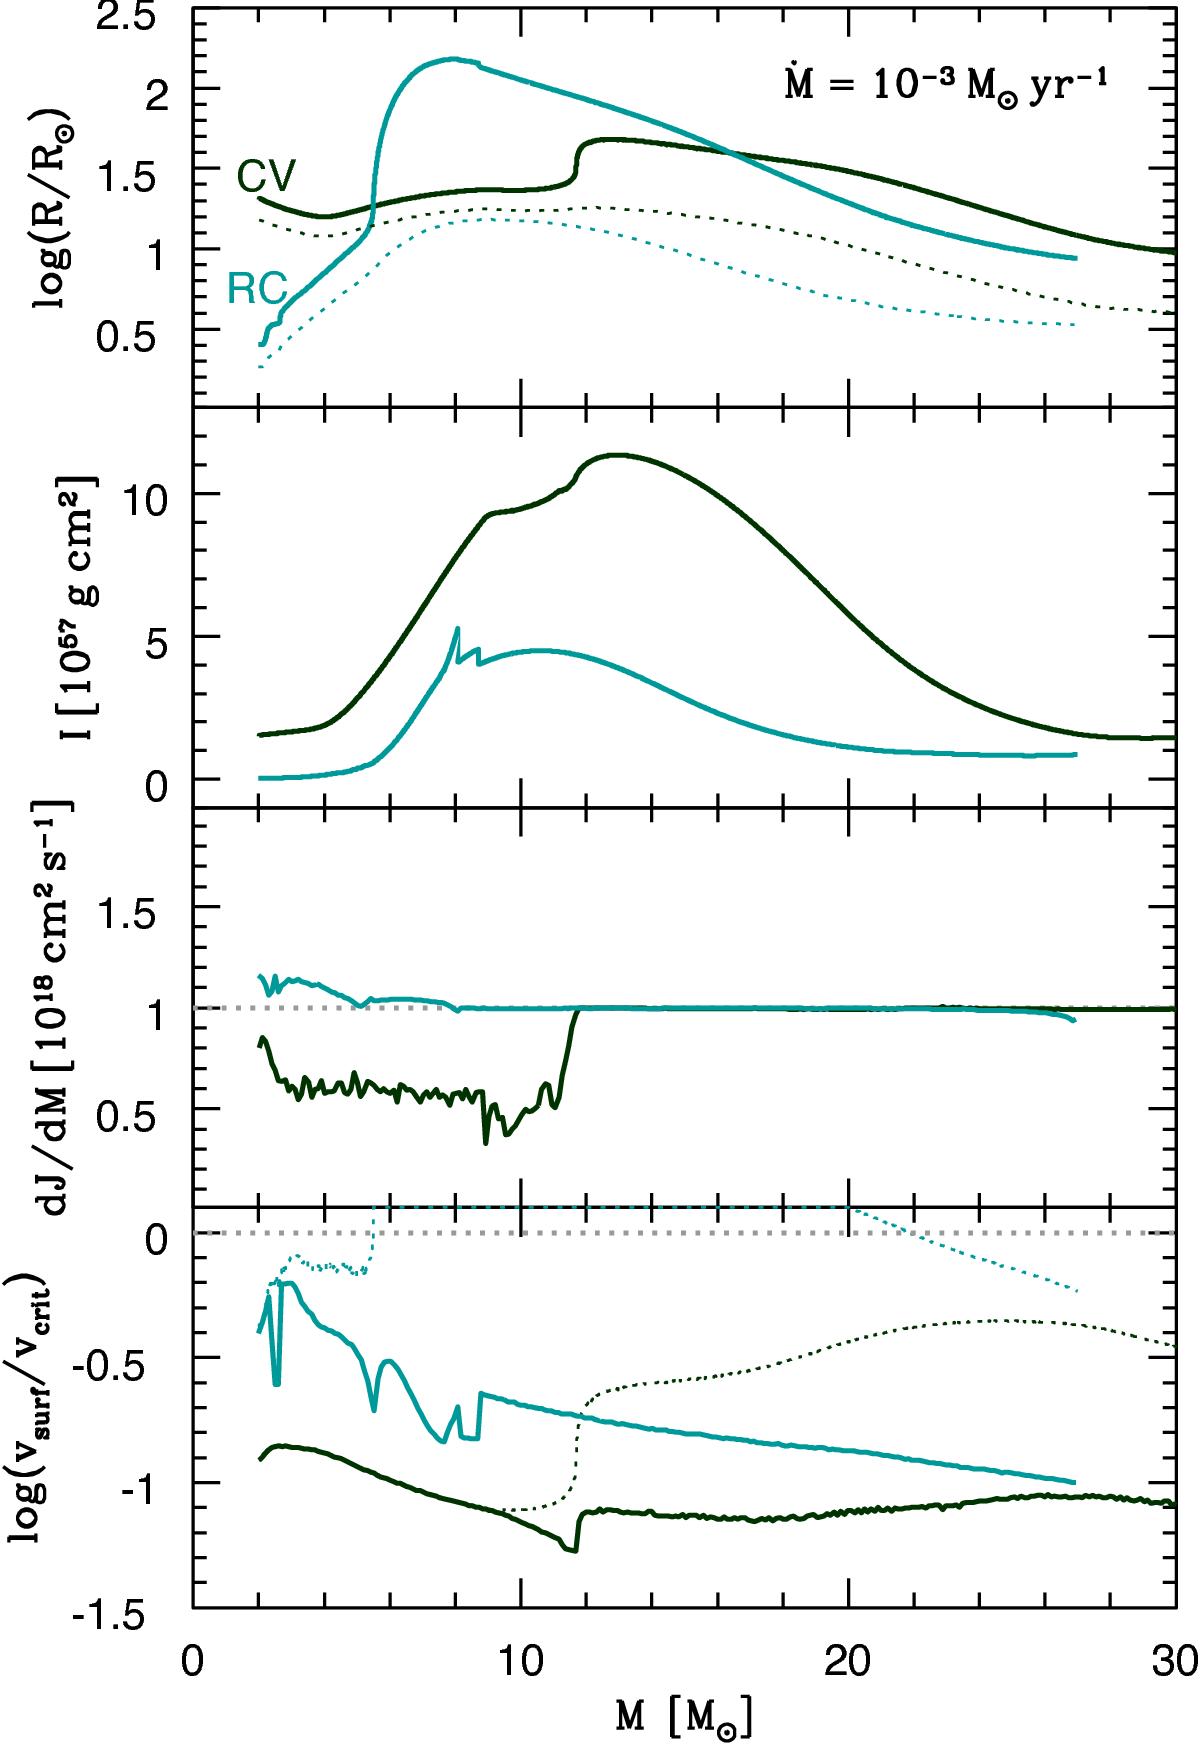
Evolution of the models described in Sect. 3.5, with Ṁ = 10-3M⊙ yr-1 and jaccr ≃ 1018 cm2 s-1, started from the CV and the RC models (black and green lines, respectively). Upper panel: stellar radius, second panel: moment of inertia, third panel: accretion of angular momentum, and the lowest panel the ratio of the surface rotation velocity to the critical velocity. In the upper panel, the solid lines correspond to the stellar radius and the dotted lines indicate the location of the layer that encloses 90% of the actual stellar mass. In the third panel, the grey dotted line is the ideal value of jaccr = 1018 cm2 s-1 while in the lowest panel, the grey dotted line indicate the critical limit and the coloured dotted lines indicate the evolution of vsurf/vcrit with the assumption of solid-body rotation (see Sect. 5.4).
Current usage metrics show cumulative count of Article Views (full-text article views including HTML views, PDF and ePub downloads, according to the available data) and Abstracts Views on Vision4Press platform.
Data correspond to usage on the plateform after 2015. The current usage metrics is available 48-96 hours after online publication and is updated daily on week days.
Initial download of the metrics may take a while.