Fig. 6
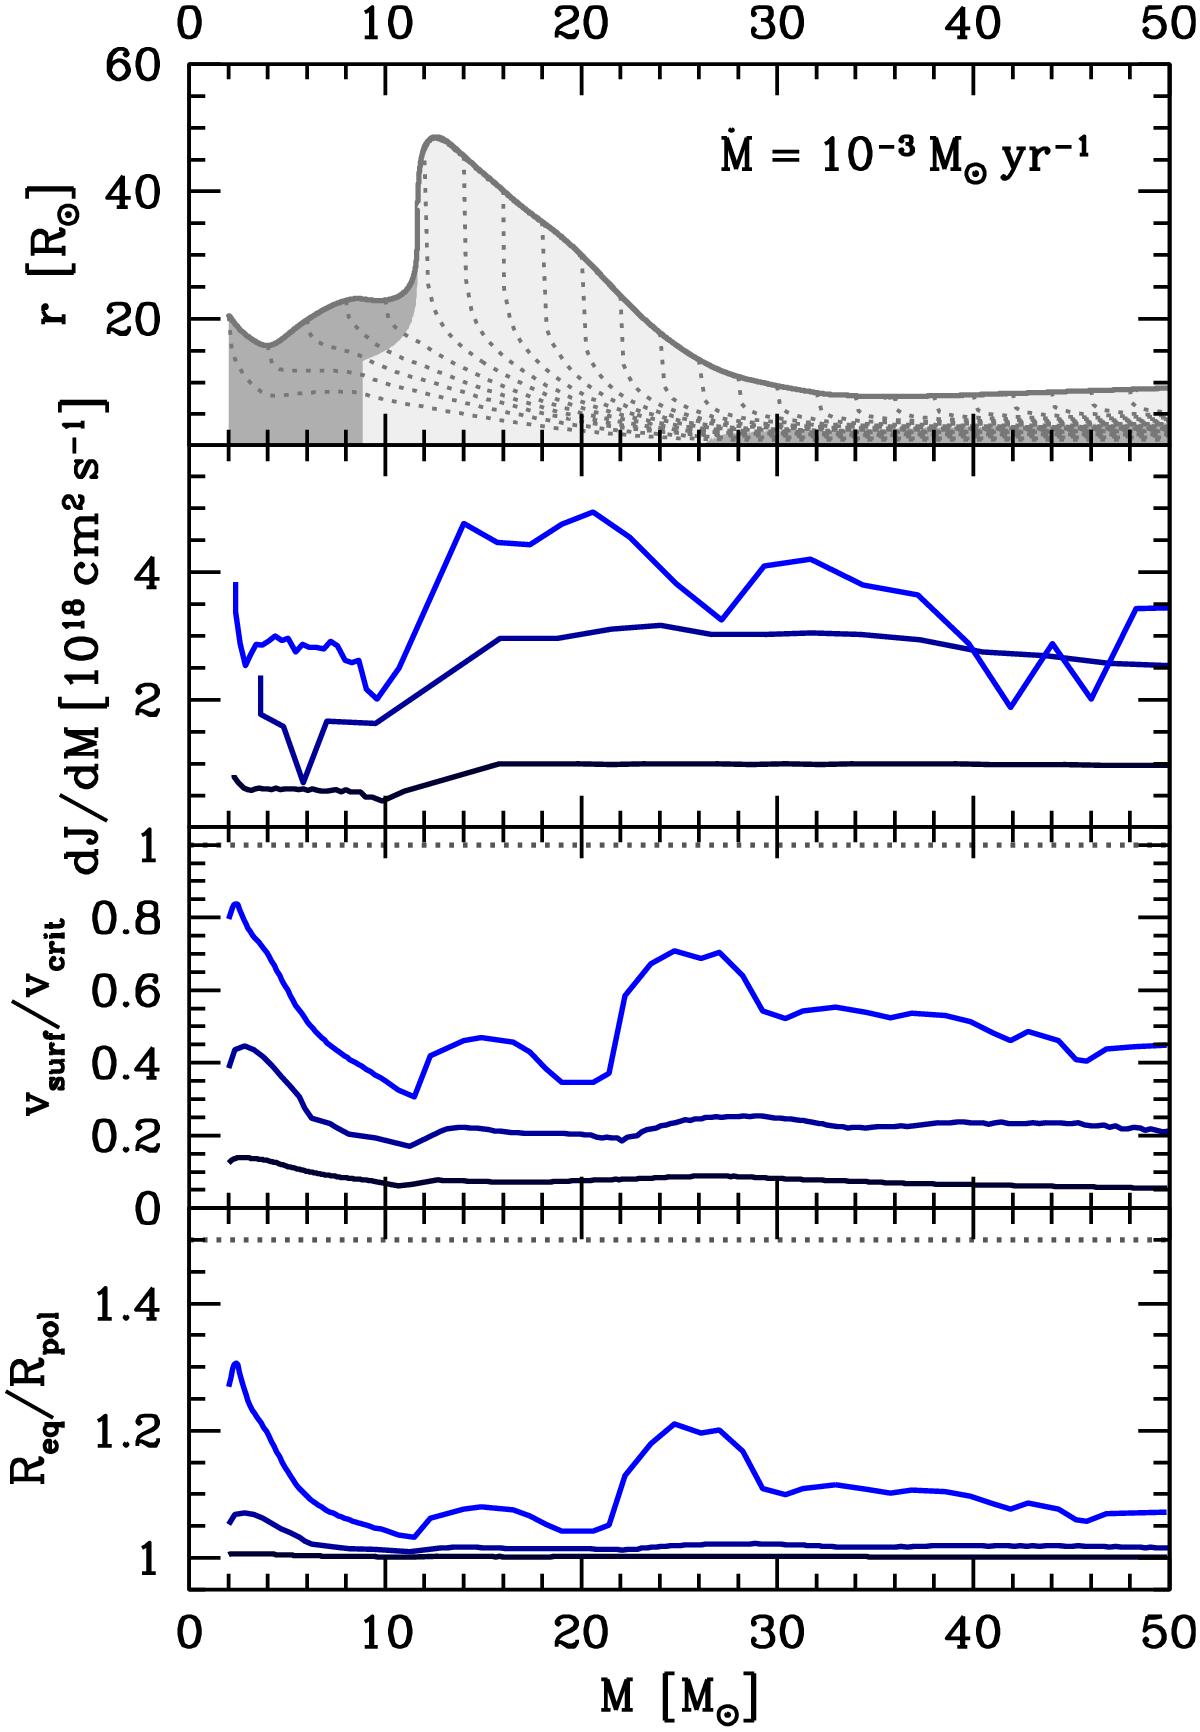
Varying the angular momentum accretion history, for Ṁ = 10-3M⊙ yr-1. Upper panel: internal structure of the non-rotating model: the upper curve is the stellar radius, the dark grey regions are convective, the light grey is radiative, and the dotted lines are ios-mass of 2, 4, 6, 8,..., M⊙. Second panel: three J-accretion histories considered and the third one, specifically, shows the evolution of vsurf/vcrit for the corresponding models (the grey dotted horizontal line indicates the critical limit), and bottom panel: deformation of the star due to rotation (Req and Rpol are the equatorial and polar radii, respectively).
Current usage metrics show cumulative count of Article Views (full-text article views including HTML views, PDF and ePub downloads, according to the available data) and Abstracts Views on Vision4Press platform.
Data correspond to usage on the plateform after 2015. The current usage metrics is available 48-96 hours after online publication and is updated daily on week days.
Initial download of the metrics may take a while.