Fig. B.1
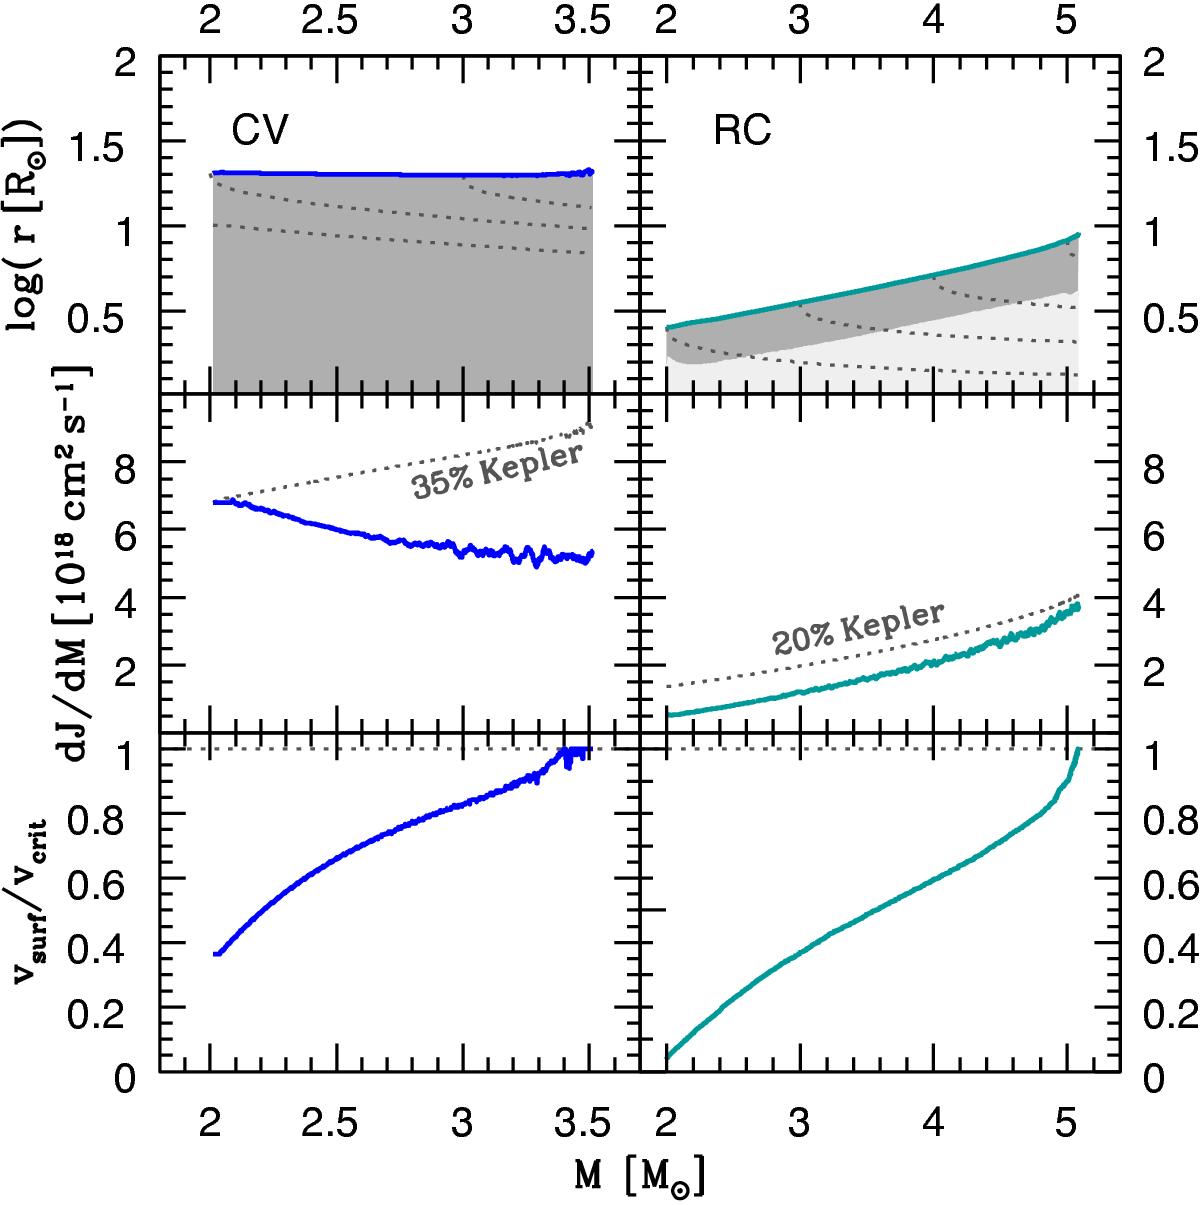
Internal structure (upper panel), angular momentum accretion rate (middle panel), and ratio vsurf/vcrit (lower panel) of the models described in Appendix B. Left-hand column shows the properties of the models started from a CV initial structure, while the right-hand column corresponds to the RC initial structure. On the top panel, the upper solid curve is the stellar radius, while convective and radiative zones are shown in dark and light grey, respectively. The dotted black curves are iso-mass at intervals of 1 M⊙. In the middle panel, the coloured lines indicate the angular momentum effectively accreted by the models, and the black dotted curves show the value of jaccr corresponding to the indicated fraction of jK. On the lower panel, the horizontal dotted line indicates the critical limit.
Current usage metrics show cumulative count of Article Views (full-text article views including HTML views, PDF and ePub downloads, according to the available data) and Abstracts Views on Vision4Press platform.
Data correspond to usage on the plateform after 2015. The current usage metrics is available 48-96 hours after online publication and is updated daily on week days.
Initial download of the metrics may take a while.