Fig. 11
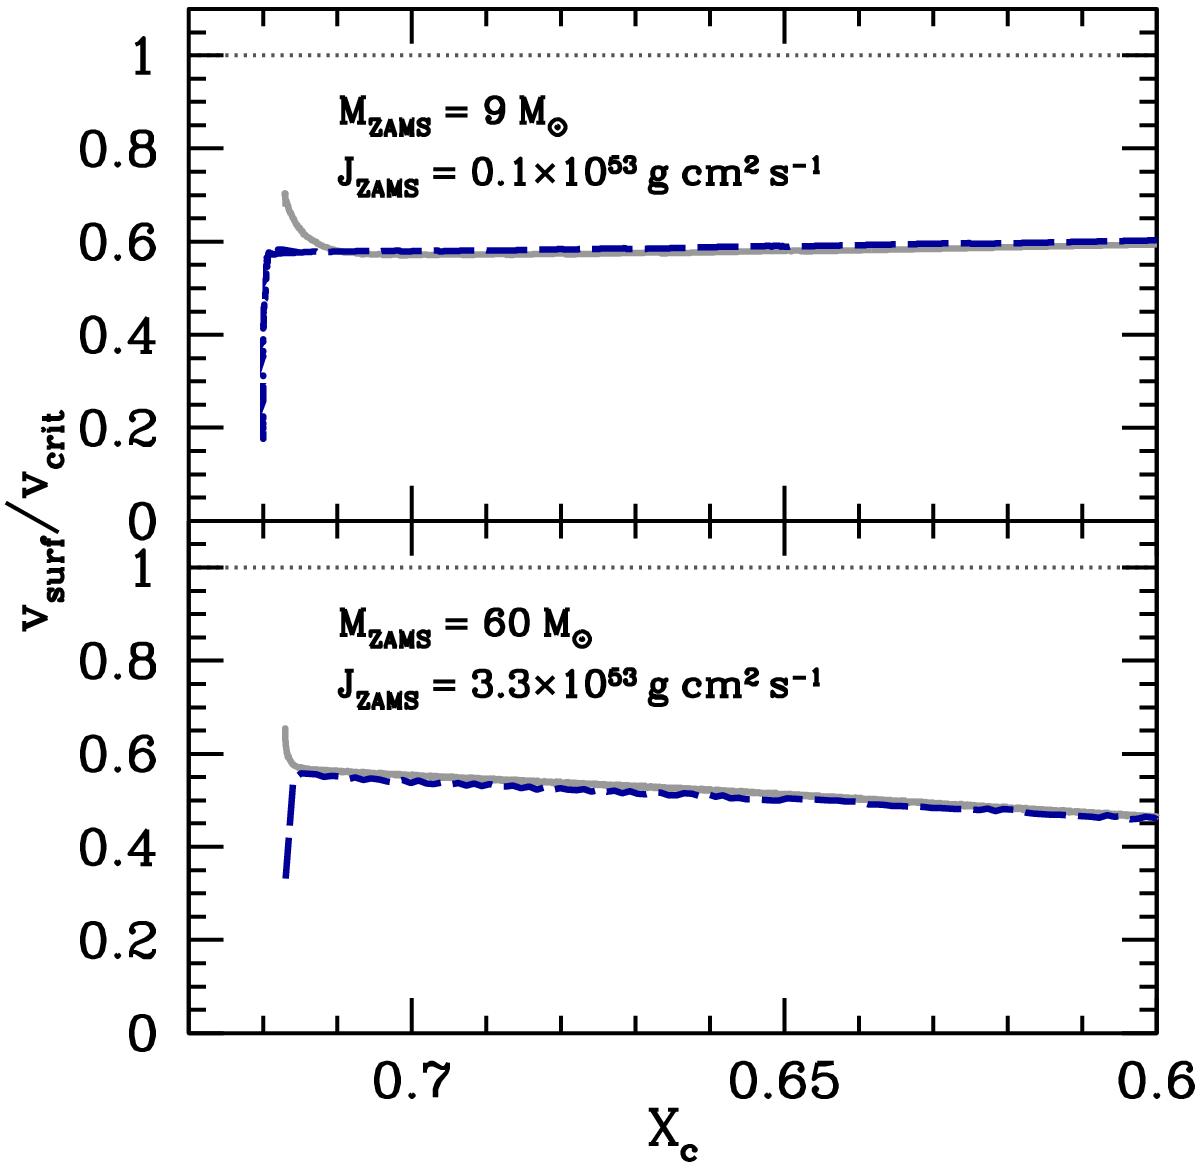
Convergence of the surface velocities towards MS equilibrium. Both panels show the evolution of the ratio vsurf/vcrit during the early MS as a function of the central mass-fraction of hydrogen that depicts time along the MS. The upper panel shows the case MZAMS = 9 M⊙ and the lower panel the case MZAMS = 60 M⊙. On each panel, the blue dashed curve corresponds to the model built by accretion, described in Sect. 4.2, while the grey solid curve indicates a model started on the ZAMS with a flat rotation profile with the same mass and angular momentum as the blue model. The grey dotted horizontal lines indicate the critical limit.
Current usage metrics show cumulative count of Article Views (full-text article views including HTML views, PDF and ePub downloads, according to the available data) and Abstracts Views on Vision4Press platform.
Data correspond to usage on the plateform after 2015. The current usage metrics is available 48-96 hours after online publication and is updated daily on week days.
Initial download of the metrics may take a while.