Fig. 10
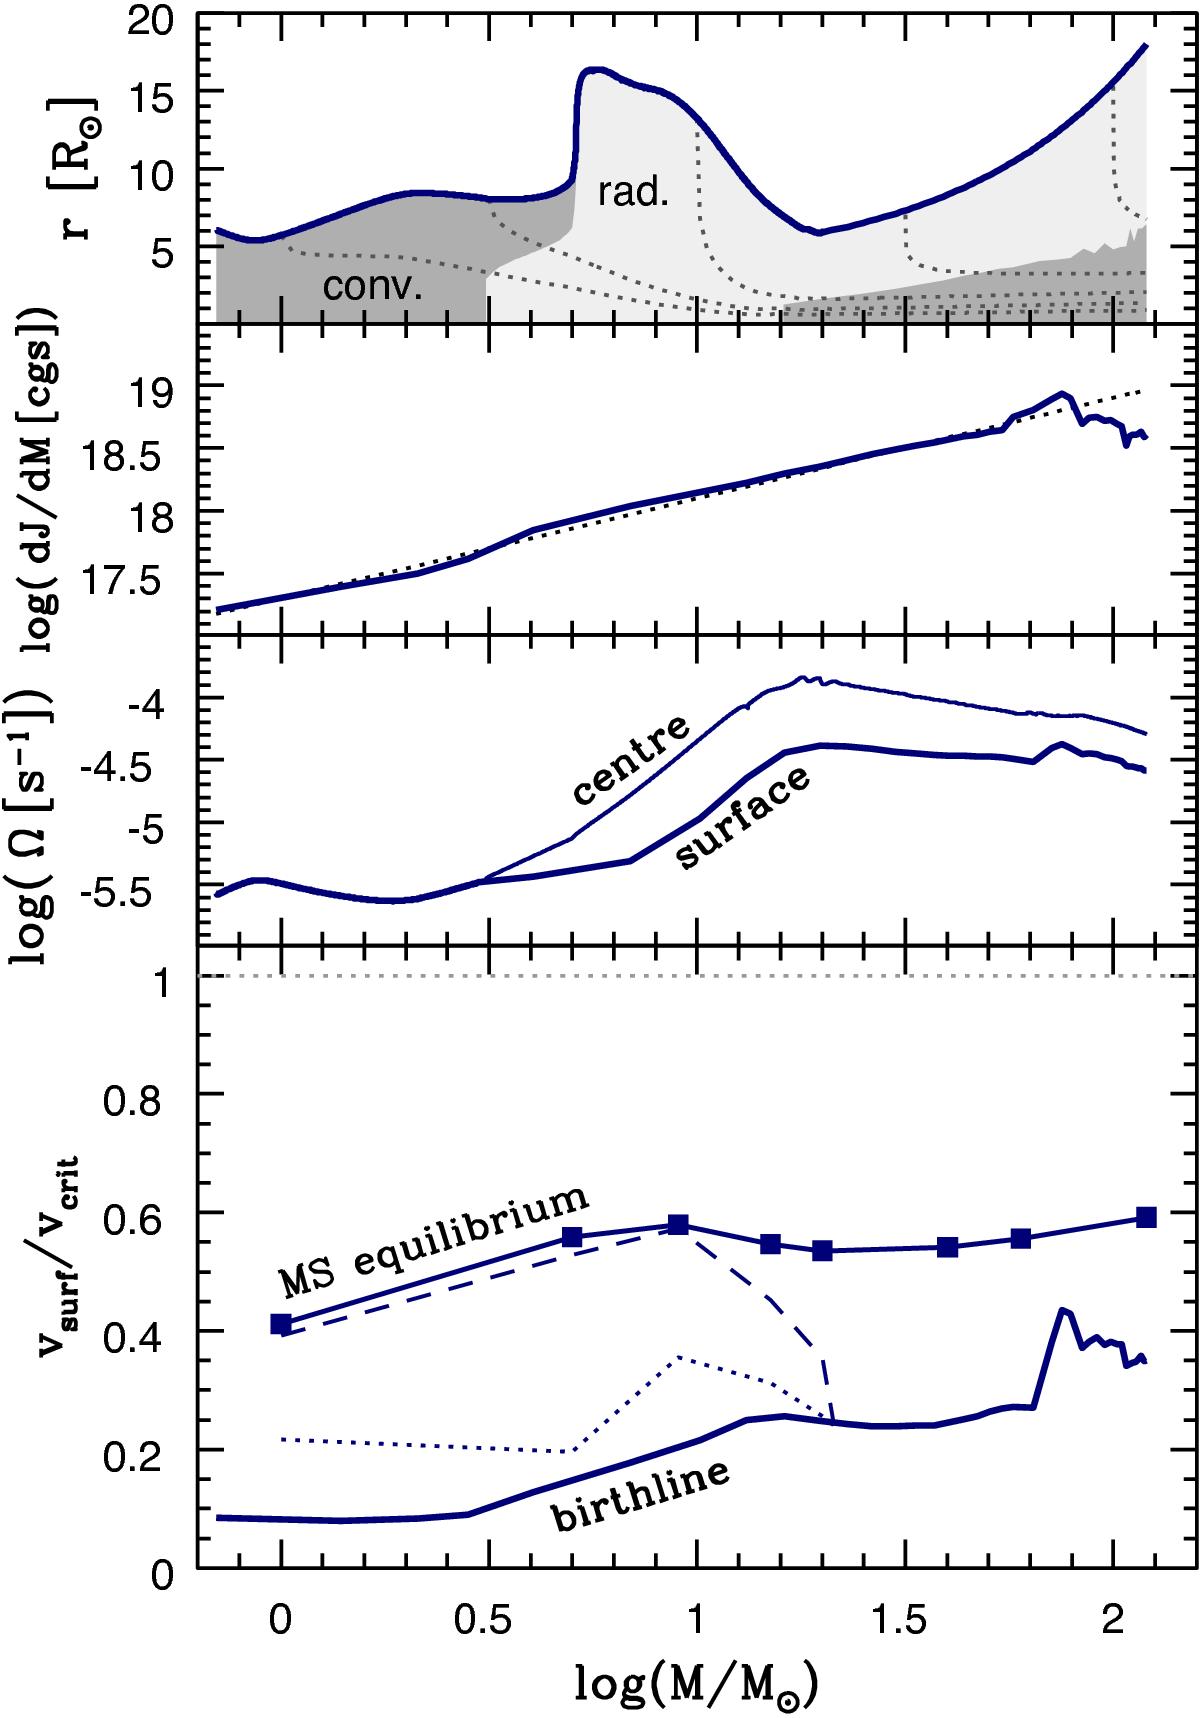
Properties of the birthline described in Sect. 4.1. Upper panel: stellar radius (upper blue curve) and the internal structure, with convective regions in dark grey, radiative regions in light grey, and iso-mass as dotted curves. Second panel: accretion of specific angular momentum (in logarithm of cm2 s-1): the black dotted line is the value given by Eq. (19) and the solid blue line indicates the angular momentum effectively accreted. Third panel: angular velocity at the surface and in the centre. The lower panel shows the ratio vsurf/vcrit (lower thick solid blue line). The filled squares connected by the thin blue line indicate the values of vsurf/vcrit reached by the models at constant mass computed from the birthline once they have converged to their MS equilibrium (see Sect. 4.2). The blue dashed line shows the values of vsurf/vcrit of the same models when they reach their minimum radius corresponding to the ZAMS. We also added the value of vsurf/vcrit these models would have at the minimum radius if angular momentum was locally conserved (blue dotted line). The grey dotted horizontal line indicates the critical limit.
Current usage metrics show cumulative count of Article Views (full-text article views including HTML views, PDF and ePub downloads, according to the available data) and Abstracts Views on Vision4Press platform.
Data correspond to usage on the plateform after 2015. The current usage metrics is available 48-96 hours after online publication and is updated daily on week days.
Initial download of the metrics may take a while.