Fig. 1
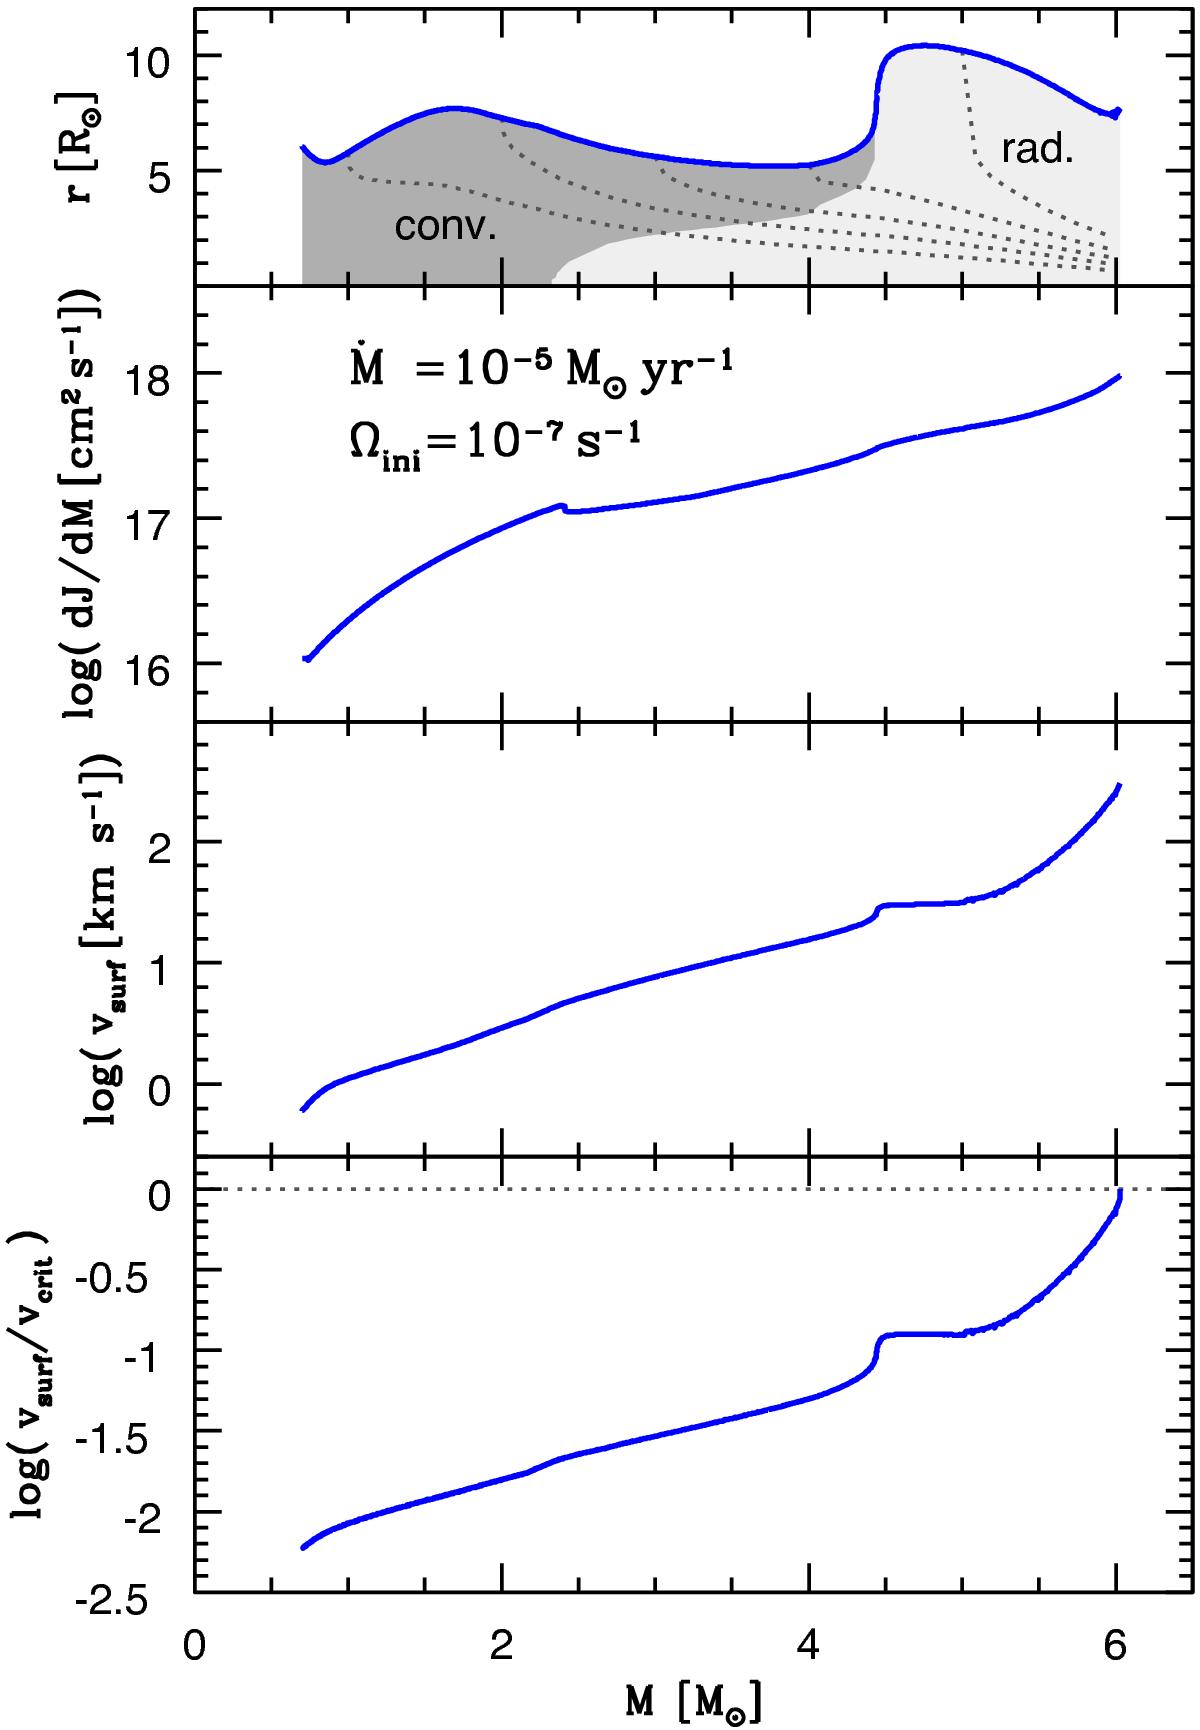
Evolution of the internal structure, the angular momentum accretion rate, and the equatorial surface velocity of the test-model at low mass-accretion rate described in Sect. 3.1, as a function of the increasing stellar mass, which is a time-coordinate in the case of accretion. Upper panel: radius (blue curve) and the internal structure, with convective zones in dark grey and radiative zones in light grey. The dark grey dotted curves are iso-mass of Mr = 1, 2, 3,..., M⊙. Second panel: angular momentum accretion rate in logarithm of ![]() . Third panel: surface velocity (at the equator) and the fourth panel shows the ratio of the surface velocity to the critical velocity. (The critical limit is indicated by the horizontal grey dotted line.)
. Third panel: surface velocity (at the equator) and the fourth panel shows the ratio of the surface velocity to the critical velocity. (The critical limit is indicated by the horizontal grey dotted line.)
Current usage metrics show cumulative count of Article Views (full-text article views including HTML views, PDF and ePub downloads, according to the available data) and Abstracts Views on Vision4Press platform.
Data correspond to usage on the plateform after 2015. The current usage metrics is available 48-96 hours after online publication and is updated daily on week days.
Initial download of the metrics may take a while.