Free Access
Fig. 12
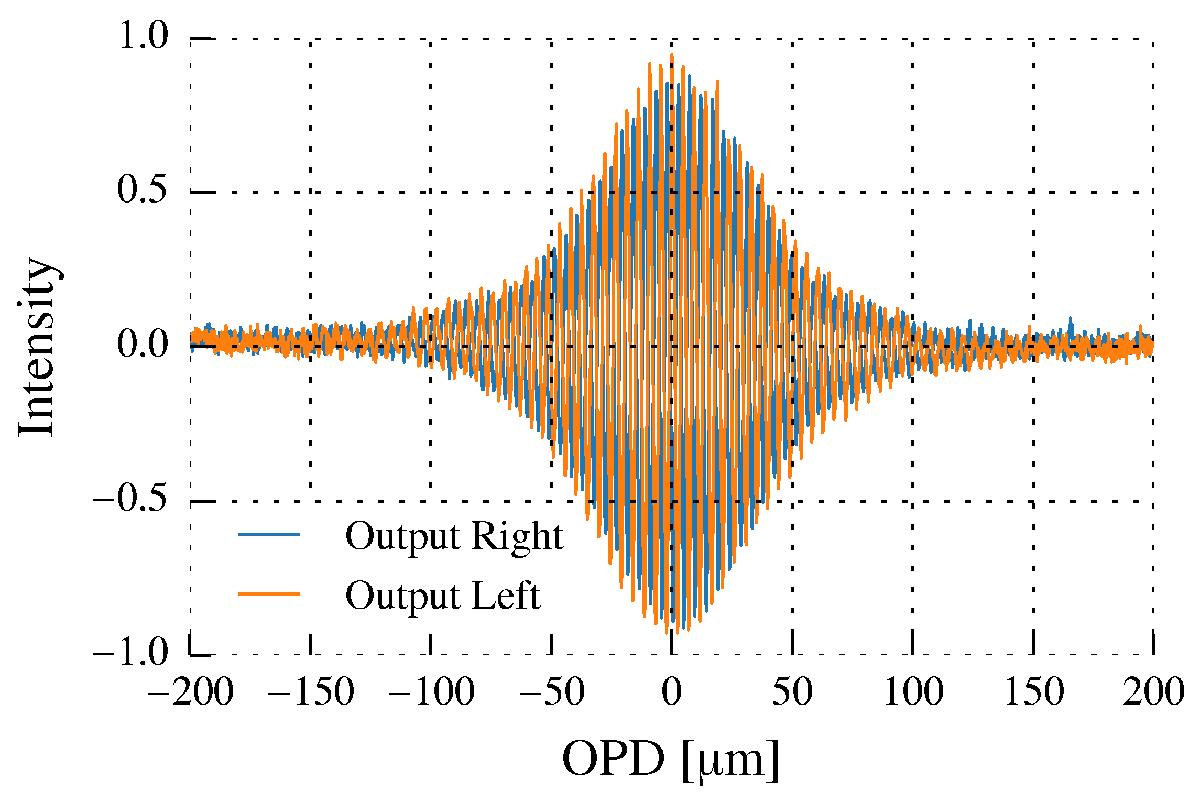
Experimental M-band interferogram of the two interferometric outputs of the coupler after photometric correction. A broadband contrast of 92.1% is measured. The spectral shape of the bandwidth is shown in Fig. 13. The respective interferograms are not perfectly π-phase shifted, as can be seen from Fig. 13.
Current usage metrics show cumulative count of Article Views (full-text article views including HTML views, PDF and ePub downloads, according to the available data) and Abstracts Views on Vision4Press platform.
Data correspond to usage on the plateform after 2015. The current usage metrics is available 48-96 hours after online publication and is updated daily on week days.
Initial download of the metrics may take a while.