Fig. 9
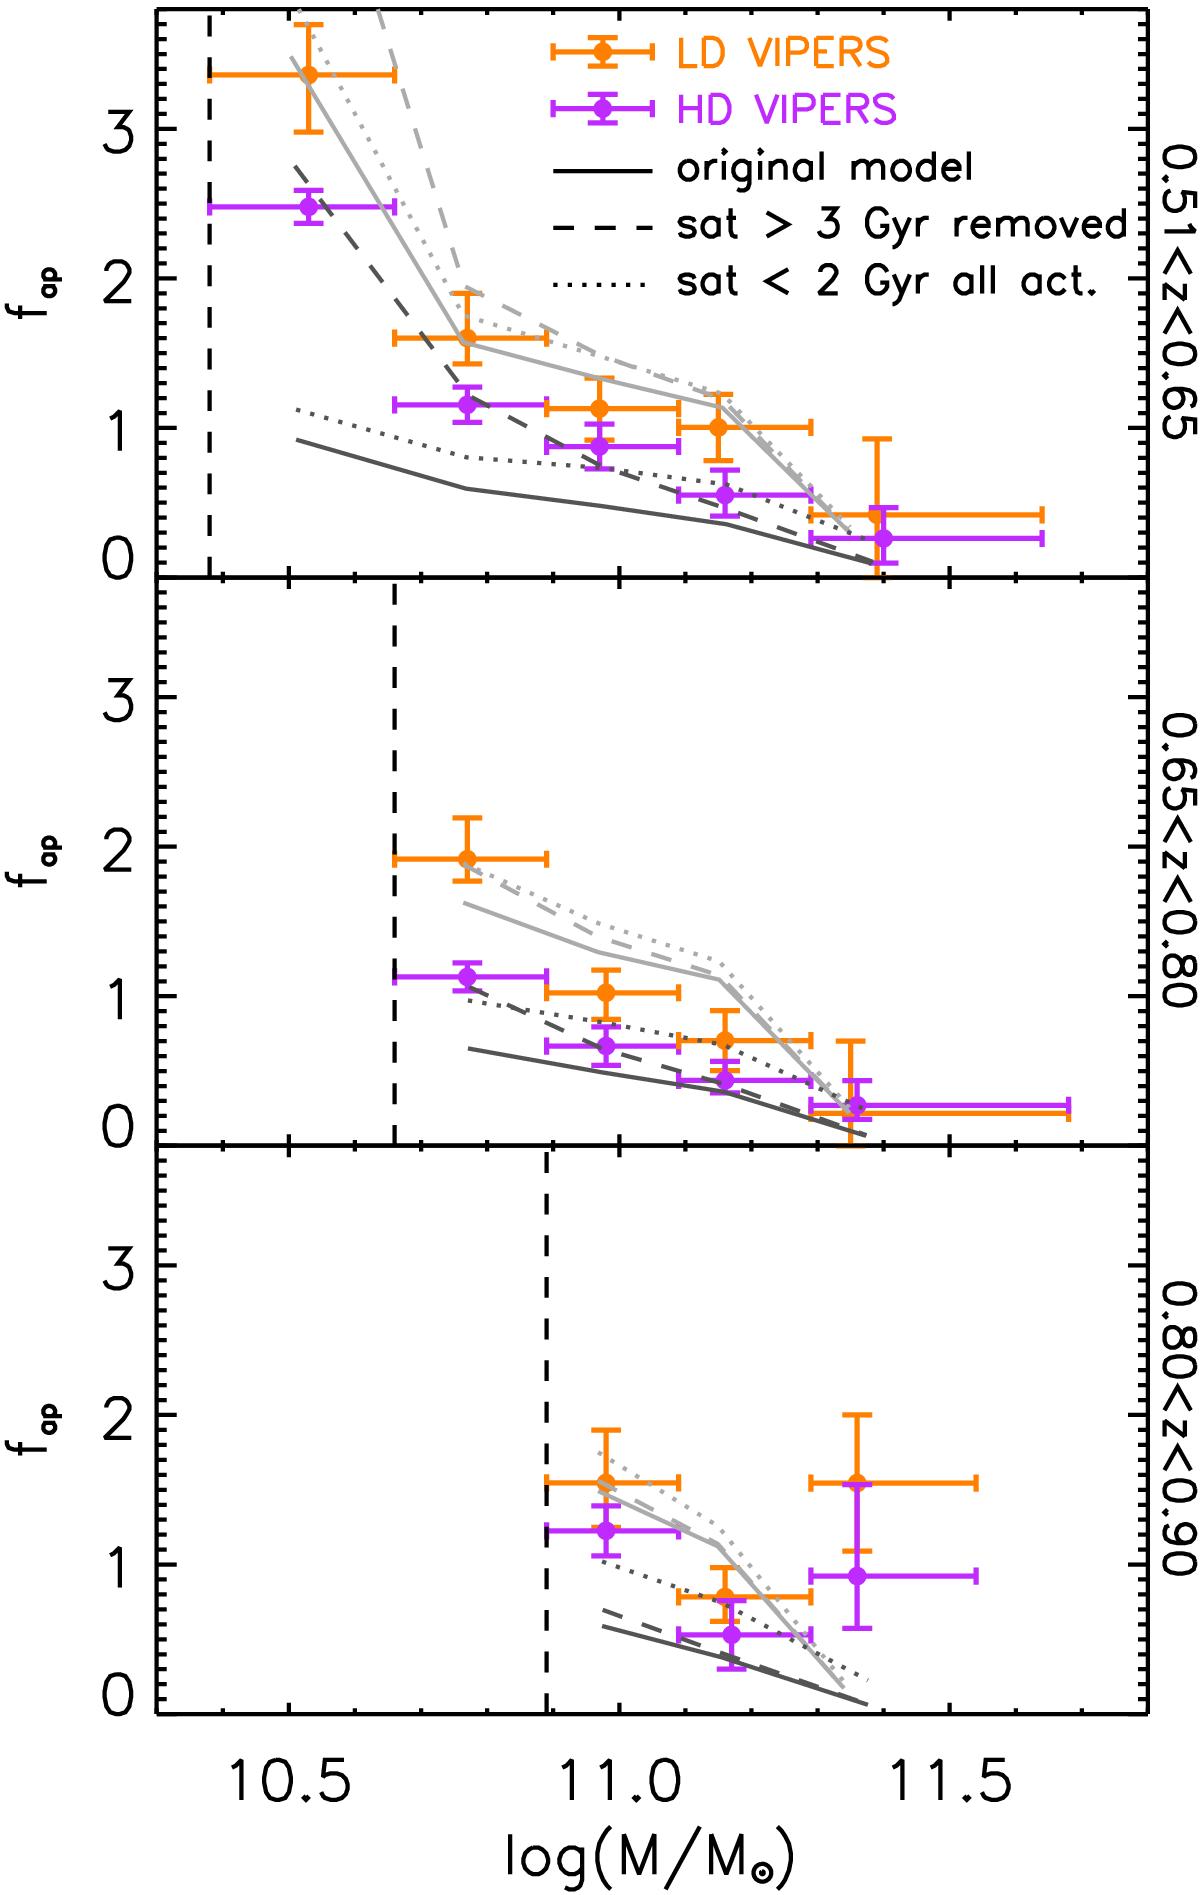
Fraction fap in the VIPERS data (orange and violet crosses) and in the model (grey lines). Crosses are the same as in Fig. 7. Solid grey lines refer to Rmocks and correspond to the grey polygons of Fig. 6. Dashed lines refer to Rmocks, but are computed after removing satellite galaxies that became satellites more than 3 Gyr before. The dotted lines refer to Rmocks, but are computed considering all the “young” satellite galaxies (i.e., that became satellites less than 2 Gyr before) to be active. See the text for more details.
Current usage metrics show cumulative count of Article Views (full-text article views including HTML views, PDF and ePub downloads, according to the available data) and Abstracts Views on Vision4Press platform.
Data correspond to usage on the plateform after 2015. The current usage metrics is available 48-96 hours after online publication and is updated daily on week days.
Initial download of the metrics may take a while.